The C4 Model, Simon Brown’s elegant framework for visualizing software architecture, has become the lingua franca for explaining systems. You’ve seen the perfect, nested diagrams: System Context for the boardroom, Containers for your tech leads, Components for developers. It solves a critical problem: moving from whiteboard scribbles that nobody can decipher to a structured, hierarchical map that aligns everyone.
But here’s the uncomfortable truth: a map is not the territory. And when your territory is a living, breathing, distributed system that scales, fails, and evolves minute-by-minute, that beautifully static C4 diagram can become a picture of a ghost. It shows you what you thought you built, not what is actually running.
Let’s explore the moment C4 stops being enough, and what you need to do next.
The C4 Promise: Clarity at a Cost
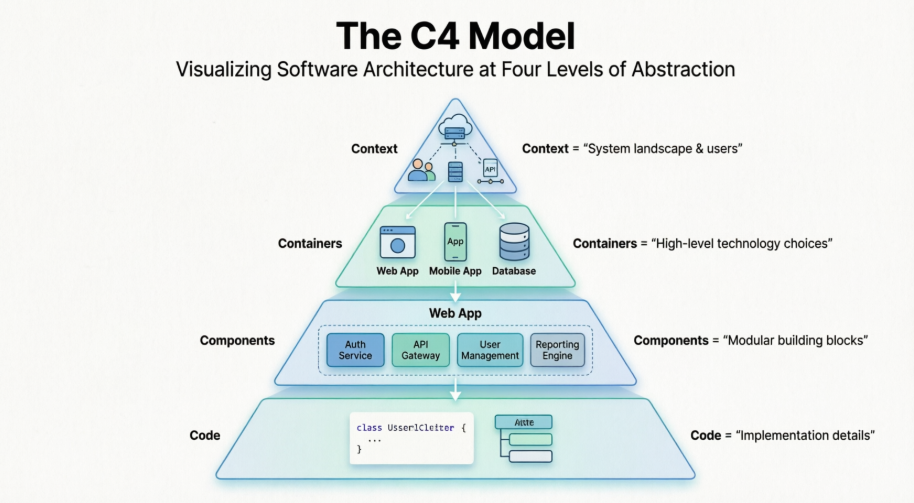
First, credit where it’s due. The C4 Model is brilliant at establishing a shared language. Its core philosophy, audience-first design and progressive disclosure, addresses the fundamental pain point of architecture diagrams that are either too high-level to be useful or too detailed to be understood. It forces you to think in abstractions: People, Software Systems, Containers, and Components.
The hierarchical levels are its superpower:
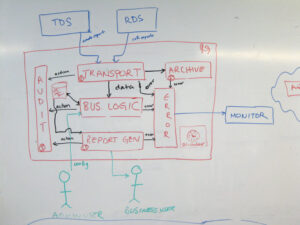
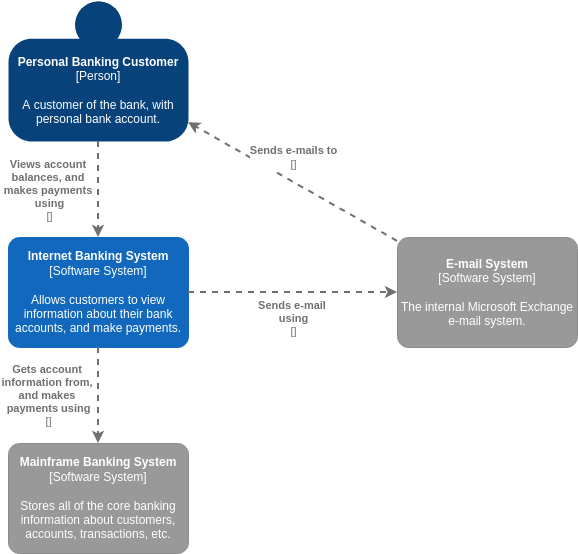
- Level 1 (Context): “Our banking app talks to a payment gateway.”
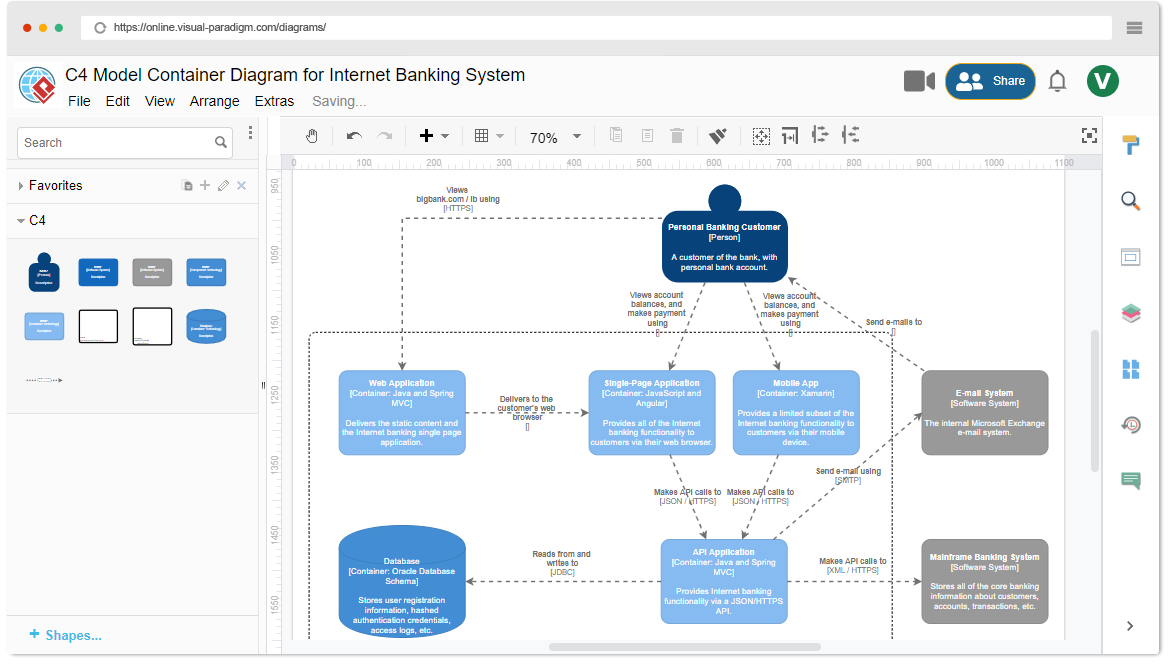
- Level 2 (Containers): “The banking app is a React frontend talking to a Node.js API, which writes to a PostgreSQL DB and uses Redis for caching.”
- Level 3 (Components): “Inside the Node.js API, we have an AuthService, a TransactionProcessor, and a NotificationEngine.”
This is fantastic for onboarding, planning, and high-level design. Tools like Visual Paradigm have turbocharged this with AI-powered generation, turning text descriptions into instant diagrams. But this is also where the first cracks appear. These diagrams document intended structure. They are a snapshot of a design-time decision. The real world is messier.
Where the Static Model Meets the Dynamic Chaos
Your perfectly rendered C4 diagram captures none of the following critical runtime realities:
1. The Illusion of Fixed Connections
Your container diagram shows a clean line: Web App -> API Service. In reality, that’s not a single connection. It’s a dynamic mesh of HTTP/2 streams, gRPC channels, or WebSocket connections that grow and shrink with load. It’s circuit breakers that trip, retry logic that kicks in, and fallback services that take over. The diagram shows a relationship, the system exhibits a behavior.
2. The Ghost of Stateful Interactions
C4 is excellent at showing what exists. It’s terrible at showing what happens over time. A user login might involve: 1) Auth Service, 2) Session写入 Redis, 3) User Profile fetch from DB, 4) Welcome notification queue. This sequence, this critical flow, is where bugs live and performance dies. The C4 Model’s supporting Dynamic Diagram is an optional afterthought, often a separate, manually drawn artifact that immediately falls out of sync.
3. The Scaling Mirage
Your container diagram proudly displays three instances of your OrderService. Lovely. At 3 AM on Black Friday, auto-scaling spins up 87 instances. Which ones are healthy? Which are consuming 90% CPU? Which are talking to which database replicas? Your static diagram is now useless for understanding system health. This is precisely the kind of runtime behavior and system scaling beyond static documentation that separates operational maturity from theoretical design.
4. The Erosion of Boundaries
Over time, “temporary” dependencies creep in. The NotificationService starts reading directly from the UserDB for a “quick fix.” Your C4 component diagram still shows a clean boundary where it only receives events. The system’s actual architecture has decayed. The diagram tells a comforting lie.
Beyond the Snapshot: The Need for a Living, Runtime View
This isn’t a flaw in the C4 Model itself, it’s a limitation of its scope. Simon Brown designed it as a communication and documentation framework. The problem arises when we treat it as a complete architectural representation.
What you need is a complementary model that shows the system in motion. Think of C4 as the blueprint. You also need the live security camera feed, the energy flow diagram, and the real-time telemetry.
This is where we venture into the territory of distributed system complexities that diagrams can’t capture. The moments where your green dashboards mask a slow, systemic failure that only reveals itself in complex, emergent interactions.
Bridging the Gap: From Static Maps to Live Topology
So, what do you do when C4 stops being enough? You layer on runtime-aware tooling and practices.
1. Treat C4 as the “Source of Truth”, Not the “State of Truth.”
Your C4 diagrams define the intended architecture. They are the contract. You then need observability tools (like distributed tracing, service mesh visualizations, and infrastructure mapping) to show the actual runtime topology. Any divergence is a signal: either the diagram needs updating (technical debt), or the system is behaving unexpectedly (an incident in the making).
2. Automate the “Dynamic Diagram” with Tracing.
Tools like OpenTelemetry can automatically generate sequence diagrams from actual traces. Instead of manually drawing how a request should flow, you can see how thousands of requests actually flowed through your services last hour. This turns the optional, static Dynamic Diagram into a live, queryable artifact.
3. Enhance C4 with Runtime Context.
Imagine a C4 container diagram, but each container is overlaid with real-time metrics: CPU, error rates, P95 latency. Or better yet, each line connecting containers is annotated with the actual RPS and error percentage. This fusion of design-time intent and runtime reality is where the real insight lives.
4. Use C4 to Frame the Problem, Not Just the Solution.
When debugging a performance issue, start with the C4 component diagram to understand the intended dependencies. Then, jump to your APM’s service map to see the actual call graph. The dissonance between the two is your first clue.
The Evolution: From Documentation to Operationalization
The future of architectural visualization isn’t just better static diagrams, even AI-generated ones. It’s the integration of the design-time model (C4) with the runtime observability plane. Tools are already hinting at this convergence.
The goal is a “living C4 model” that is continuously informed by the running system. Did a new service dependency appear in the traces? Flag it on the diagram. Has a container’s communication pattern radically shifted since last deployment? Highlight the change.
This moves architecture from being a documentation exercise to an operational dashboard. It turns your C4 model from a museum piece into the cockpit of your system.
Conclusion: C4 is Necessary, But Not Sufficient
The C4 Model is an indispensable tool for creating a shared understanding of your system’s static structure. It brings order to chaos and gives teams a common vocabulary. For greenfield design and stakeholder communication, it’s often enough.
But for anyone responsible for the health, performance, and evolution of a complex, distributed system in production, relying solely on C4 is like navigating a storm with last year’s weather map. You need the static blueprint and the dynamic telemetry. You need to know not just the intended software architecture patterns that define system boundaries, but how those boundaries hold (or crumble) under real load.
Use C4 to define your world. Then, build the tools to watch it live in. The gap between the two is where the real engineering happens.