The 60-Second Tax: Why Your Snowflake Bill Is Mostly Paying for Silence

You’re in the weekly Snowflake optimization review. The bill is over budget again. The team already did the “normal” cleanup: 60-second auto-suspend, smaller warehouses, and optimization on the longest-running queries. Finance asks the same question: if we already optimized Snowflake, why is the bill still this high?
The uncomfortable truth is that most Snowflake cost optimization is theater. You’re tuning queries while ignoring the structural billing mechanics that turn small workloads into big invoices. Understanding the broader landscape of unexpected cloud bill shocks and migration pitfalls starts with recognizing that cloud data warehouses have a dirty little secret: they charge you for doing nothing.
The 60-Second Minimum Is a Regressive Tax on Analytics
Snowflake bills compute in credits, with warehouses charging per second while active. But here’s the catch that finance doesn’t understand: every warehouse carries a 60-second billing minimum. An X-Small warehouse consumes 1 credit per hour, a Small uses 2, a Medium uses 4, and so on doubling up the chain. But time is the hidden multiplier.
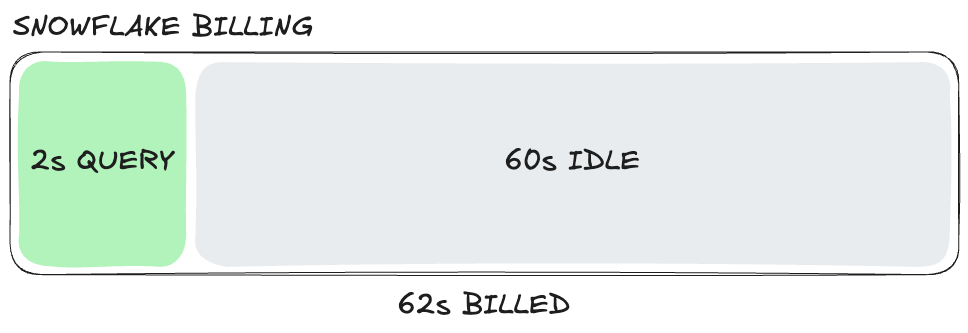
Consider the dashboard query that runs in 2 seconds. Your warehouse starts, executes the query, and sits idle waiting for the auto-suspend timer. If you’ve set auto-suspend to 60 seconds (the “optimized” setting), you pay for 62 seconds of compute to get 2 seconds of work. That’s a 31x markup on actual processing time.
Now imagine a second 2-second query lands at second 59. The auto-suspend timer resets. You’ve now paid for 124 seconds of billing to execute 4 seconds of actual work. Scale this pattern across thousands of dashboard queries per day across multiple warehouses, and idle time becomes your largest line item, not compute, not storage, but waiting.

This isn’t an edge case. This is the standard operational model for BI workloads, embedded analytics, and self-serve reporting. The bursts arrive randomly, wake up the warehouse, and leave you holding the bag for a full minute of silence.
Warehouse Sprawl: Death by a Thousand 60-Second Cuts
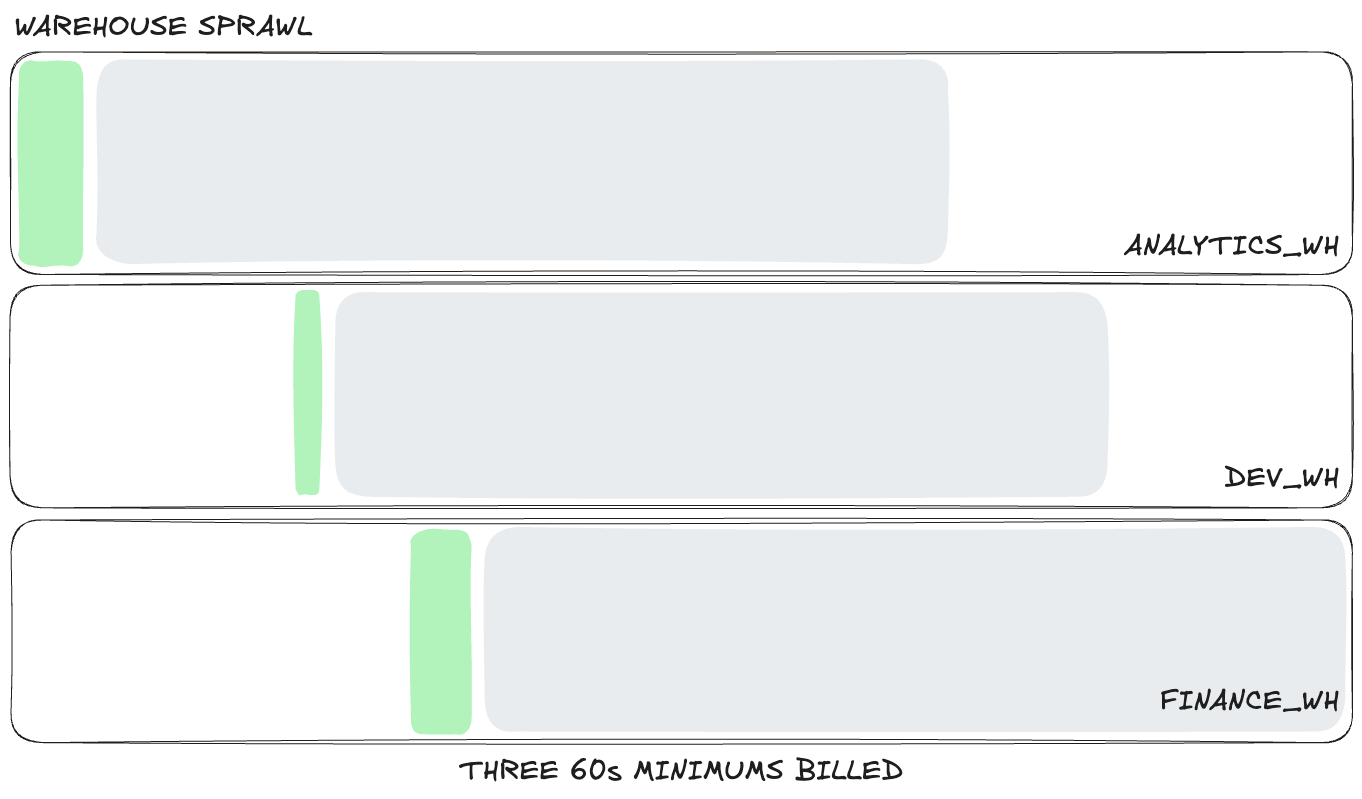
The conventional wisdom says isolate workloads: give Finance their FINANCE_WH, give Dev their DEV_WH, keep everything separate for “cost attribution.” It sounds disciplined, but it’s fiscally catastrophic.
Each warehouse suspends and resumes on its own clock. Each carries its own 60-second minimum, its own idle gaps, and its own cache. When finance runs a 2-second dashboard query on their warehouse, and developers run a 2-second ad hoc query on theirs a few seconds later, you’re paying for two separate 60-second billing windows. You’ve turned 4 seconds of work into 120 seconds of charges.
For similar read-heavy traffic, consolidation is cheaper than isolation. If those short queries land on the same warehouse, they share the same active minute and benefit from cache reuse. The math is brutal: warehouse sprawl doesn’t just split costs, it multiplies them.
The catch is concurrency. On Snowflake Standard tier, multi-cluster warehouses aren’t available, so teams scale up warehouse size to handle queueing. That drops you into the next trap: sizing for the busiest moment rather than the average query. How architectural choices and system design fundamentally impact long-term infrastructure spending becomes clear when you realize you’ve been sizing warehouses for the 99th percentile query while 99% of your traffic could run on hardware a fraction of the size.
The Sizing Delusion: Optimizing for the Wrong Percentile
Most teams size warehouses for the hardest query. If your worst join needs a Medium warehouse (4 credits/hour), but your dashboard traffic would be fine on an X-Small (1 credit/hour), you’re taxing every average query to ensure the edge case runs fast.
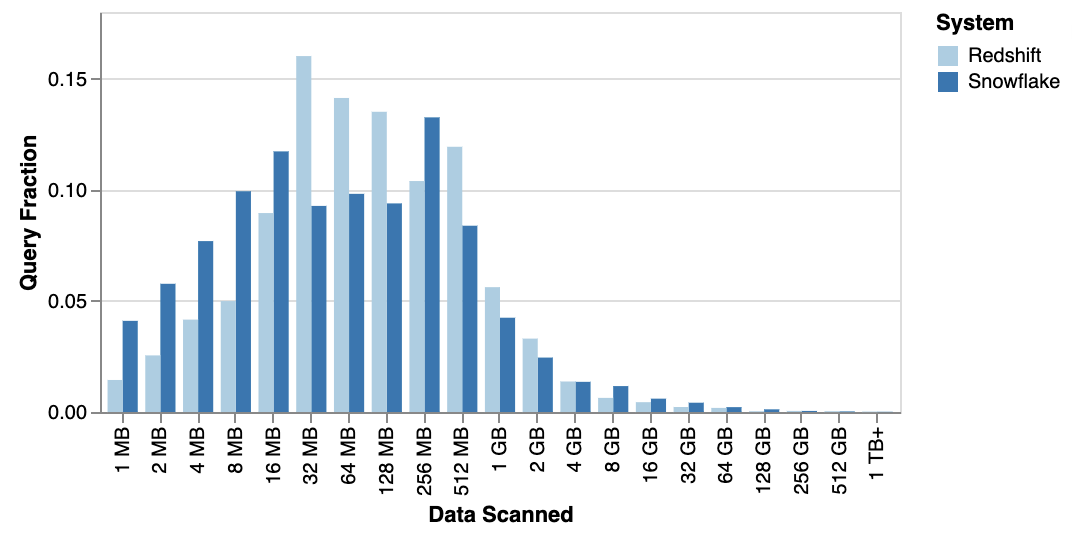
The data tells a different story. According to Fivetran’s analysis of Snowflake and Redshift usage, the 99.9th-percentile query scanned about 300 GB. In MotherDuck’s analysis of the Redset benchmark, only 1.1% of queries fell in the 100 GB to 1 TB bucket, implying roughly 99% scanned under 100 GB.
Your “Large” warehouse isn’t running large queries. It’s running small queries on expensive hardware because you don’t have a query complexity problem, you have an engine mismatch problem.
Audit Your Waste: The SQL That Reveals the Truth
Before you buy another optimization tool, measure what you actually have. The goal is to answer one question: how many queries are actually small?
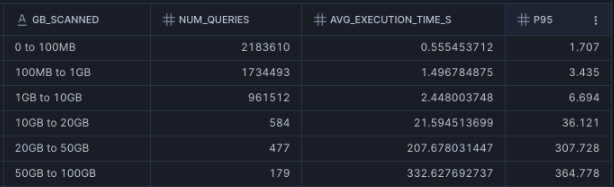
Use this audit query to categorize your workload by scan size. If more than 80% of your read queries fall below 100 GB, you have a strong signal that a large share of your workload is a candidate for routing to cheaper compute:
-- Update the SET command below to your READ warehouses

SET warehouse_names = 'COMPUTE_WH, DEV_WH';

SELECT
    CASE
        WHEN bytes_scanned / power(1024,3) < 0.1 THEN 1
        WHEN bytes_scanned / power(1024,3) < 1 THEN 2
        WHEN bytes_scanned / power(1024,3) < 10 THEN 3
        WHEN bytes_scanned / power(1024,3) < 20 THEN 4
        WHEN bytes_scanned / power(1024,3) < 50 THEN 5
        WHEN bytes_scanned / power(1024,3) < 100 THEN 6
        WHEN bytes_scanned / power(1024,3) < 200 THEN 7
        WHEN bytes_scanned / power(1024,3) < 500 THEN 8
        WHEN bytes_scanned / power(1024,3) < 1000 THEN 9
        ELSE 10 END as gb_ranking
   , CASE
        WHEN bytes_scanned / power(1024,3) < 0.1 THEN '0 to 100MB'
        WHEN bytes_scanned / power(1024,3) < 1 THEN '100MB to 1GB'
        WHEN bytes_scanned / power(1024,3) < 10 THEN '1GB to 10GB'
        WHEN bytes_scanned / power(1024,3) < 20 THEN '10GB to 20GB'
        WHEN bytes_scanned / power(1024,3) < 50 THEN '20GB to 50GB'
        WHEN bytes_scanned / power(1024,3) < 100 THEN '50GB to 100GB'
        WHEN bytes_scanned / power(1024,3) < 200 THEN '100GB to 200GB'
        WHEN bytes_scanned / power(1024,3) < 500 THEN '200GB to 500GB'
        WHEN bytes_scanned / power(1024,3) < 1000 THEN '500GB to 1TB'
        ELSE '1TB+' END as gb_scanned
   , COUNT(*) as num_queries
   , AVG(execution_time)*0.001 as avg_execution_time_s
   , PERCENTILE_DISC(0.95) WITHIN GROUP (ORDER BY execution_time ASC)*0.001 as p95
FROM snowflake.account_usage.query_history AS qh
WHERE
    1=1
    AND qh.warehouse_name IN (SELECT TRIM(VALUE) FROM TABLE(SPLIT_TO_TABLE($warehouse_names, ',')))
    AND qh.warehouse_size IS NOT NULL
    AND qh.start_time >= current_date - 90
    AND qh.query_type = 'SELECT'
GROUP BY 1,2
ORDER BY 1 ASC;
If your results look like this, 100% of queries scanning less than 100GB, 99% scanning less than 10GB, you don’t have a query optimization problem. You have an engine selection problem.
Similarly, identify warehouses that are effectively sleeping on the job:
-- Find warehouses with dangerous auto-suspend settings
SHOW WAREHOUSES;

SELECT "name" AS warehouse_name, "auto_suspend"
FROM TABLE(RESULT_SCAN(LAST_QUERY_ID()))
WHERE "auto_suspend" > 120 --auto-suspend after 120 seconds of inactivity
   OR "auto_suspend" IS NULL
ORDER BY "auto_suspend" DESC NULLS FIRST;
And detect the overprovisioned behemoths running simple queries:
-- Identify Large+ warehouses running lightweight queries
SELECT
    warehouse_name,
    warehouse_size,
    COUNT(*)                                 AS query_count,
    AVG(execution_time) / 1000               AS avg_exec_seconds,
    AVG(bytes_scanned) / 1e6                 AS avg_mb_scanned,
    CASE warehouse_size
        WHEN 'X-Small'  THEN 1
        WHEN 'Small'    THEN 2
        WHEN 'Medium'   THEN 4
        WHEN 'Large'    THEN 8
        WHEN 'X-Large'  THEN 16
        WHEN '2X-Large' THEN 32
        WHEN '3X-Large' THEN 64
        WHEN '4X-Large' THEN 128
        ELSE NULL
    END                                      AS warehouse_credit_multiplier
FROM snowflake.account_usage.query_history
WHERE start_time >= DATEADD(day, -14, CURRENT_TIMESTAMP())
  AND warehouse_name IS NOT NULL
  AND warehouse_size IN ('Large', 'X-Large', '2X-Large', '3X-Large', '4X-Large')
  AND execution_status = 'SUCCESS'
GROUP BY warehouse_name, warehouse_size
HAVING AVG(bytes_scanned) / 1e6 < 100
   AND AVG(execution_time) / 1000 < 30
ORDER BY warehouse_credit_multiplier DESC, avg_mb_scanned ASC;
The Multi-Engine Escape Hatch
Snowflake optimization reduces waste within Snowflake, but the floor is your cost per credit. Compute costs typically account for around 80% of total Snowflake bills, with Enterprise Edition running approximately $3 per credit in AWS us-east-1. An equivalent 8 vCPU machine on AWS costs $0.3/hr on demand and $0.1/hr on spot. The math isn’t subtle.
Most teams don’t have a Snowflake problem. They have a workload placement problem. If your workload is mostly BI, embedded analytics, or repeated short queries, a large share of those queries don’t need a distributed warehouse. Filtered aggregations, joins across a few tables, and reporting rollups that scan moderate amounts of data and return small result sets can run on single-node analytical engines like DuckDB for a fraction of the cost.
Apache Iceberg makes this model practical. When your data is stored as Iceberg in object storage, multiple engines can read the same data through a shared catalog. Snowflake Horizon Catalog can expose Snowflake-managed Iceberg tables to external engines such as DuckDB, Spark, Dremio, and Trino. The table stays in place, you simply change the compute engine.
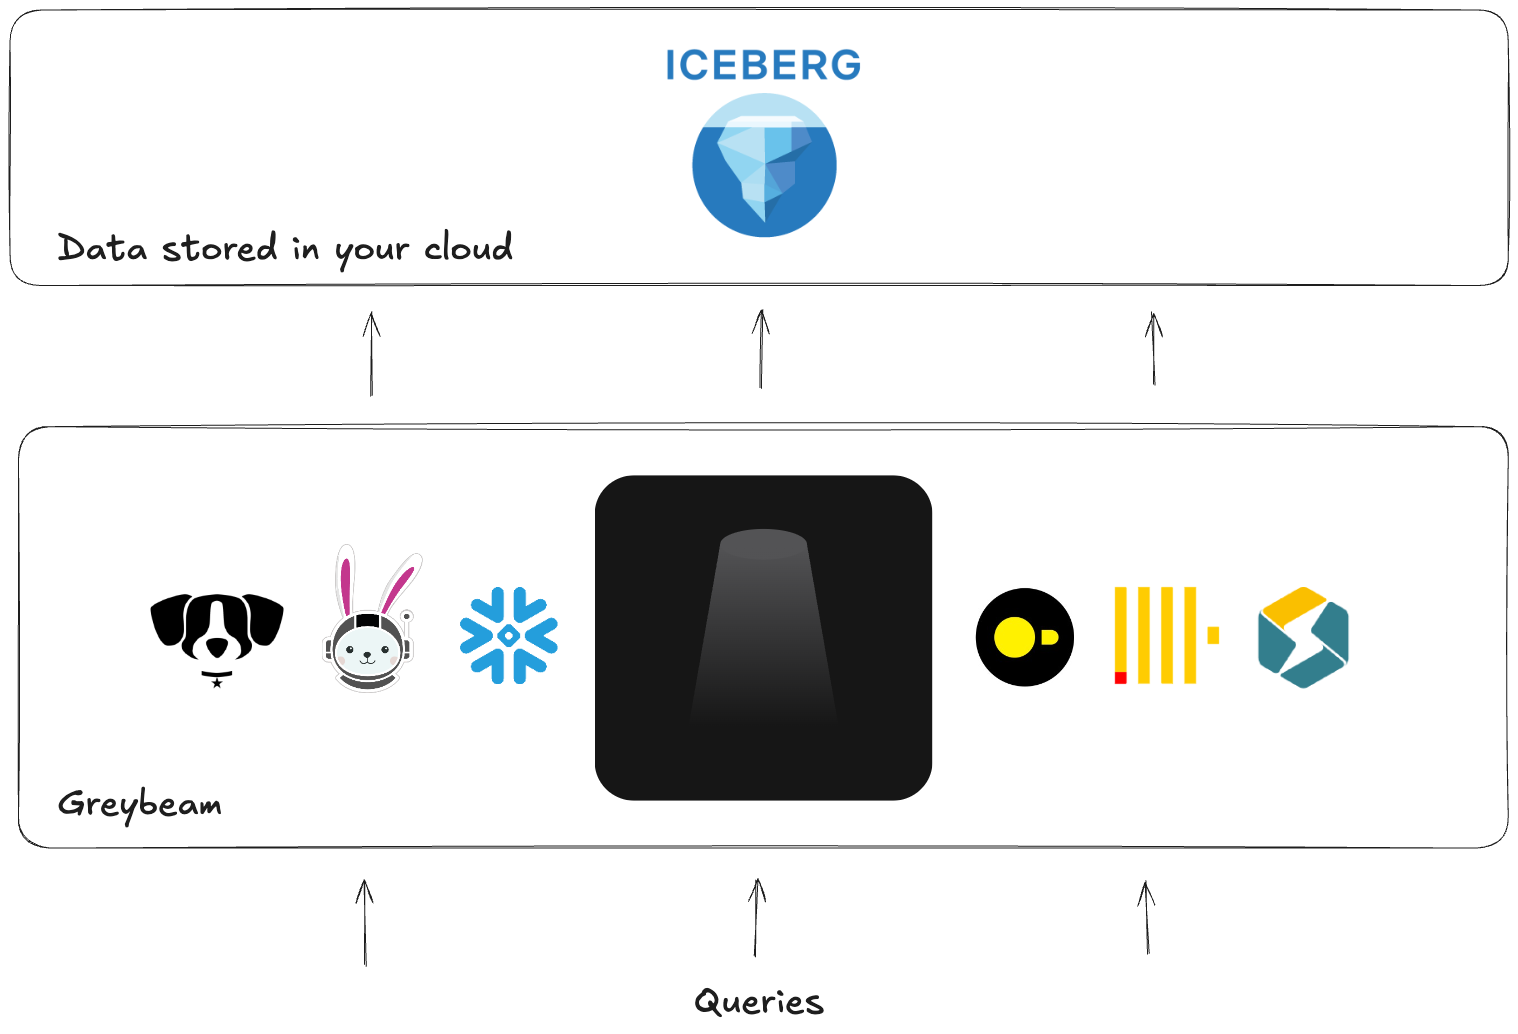
This is where query routing becomes interesting. Instead of asking “How do I optimize Snowflake?”, you ask “Which engine should run this query?” Small queries route to DuckDB (or similar), heavy scans and writes stay on Snowflake. Teams like Headset saw 93% cost reduction using this approach, while Xometry achieved 78% reduced Snowflake costs and 3x faster queries.
The hard part isn’t running DuckDB, it’s making the whole system behave like nothing changed. You need SQL translation for dialect differences, catalog resolution for databases and schemas, validation for result correctness, and routing logic that knows what should stay on Snowflake. Moving workload to local hardware to reduce recurring cloud subscription fees follows similar principles of right-sizing compute to the actual task rather than defaulting to cloud scale for every operation.
Automation as Financial Discipline
While you’re restructuring your engine strategy, put guardrails in place to prevent the next bill shock. Resource monitors are Snowflake’s native circuit breakers, they don’t make normal workloads cheaper, but they stop one bad query or one bad schedule from becoming a spike in costs.
Create monitors that align with actual business SLAs:
CREATE OR REPLACE RESOURCE MONITOR ad_spend_warehouse_monitor
WITH CREDIT_QUOTA = 100 -- Set quota based on expected usage
TRIGGERS
    ON 75 PERCENT DO NOTIFY
    ON 95 PERCENT DO SUSPEND
    ON 100 PERCENT DO SUSPEND_IMMEDIATE;
For infrastructure consistency, define these in Terraform:
resource "snowflake_resource_monitor" "ad_pacing_monitor" {
  name           = "ad_pacing_warehouse_monitor"
  credit_quota   = 100
  notify_triggers = [75, 90]
  suspend_trigger = 95
  suspend_immediate_trigger = 100
}

resource "snowflake_warehouse" "ad_pacing_wh" {
  name           = "AD_PACING_WH"
  resource_monitor = snowflake_resource_monitor.ad_pacing_monitor.name
  // other warehouse settings like auto_suspend, scaling_policy, etc.
}
Align your refresh cadence to actual business needs. If a dashboard gets opened once in the morning, hourly refreshes are wasted spend. If downstream teams only care about yesterday’s numbers, near-real-time pipelines are buying you very little.
The Boring Fixes Before the Big Moves
- Audit warehouse sizing against real query patterns, not intuition
- Set auto-suspend based on actual gaps in traffic (60 seconds is almost always ideal, but going lower can trigger multiple minimums)
- Check Gen1 vs Gen2, test whether your workloads actually benefit from Gen2 improvements
- Implement resource monitors and statement timeouts to catch runaway queries
- Consolidate similar read-heavy workloads to improve cache reuse and reduce idle warehouses
Do all of that first. If you’re still bleeding money, you don’t have a configuration problem, you have an architecture problem. The cheapest optimization isn’t another warehouse setting, it’s choosing a different engine for the 99% of queries that don’t need warehouse-scale compute.
The industry is moving away from the idea that one warehouse fits all. Open table formats and open source analytical engines are making it normal to separate storage from compute and pick the engine that actually matches the query. That’s the bigger frame for Snowflake cost control: sometimes the answer is better warehouse hygiene, sometimes the answer is that Snowflake is still the right engine for heavy lifting, but for a large class of analytics queries, you’re paying premium prices for commodity work.
Stop tuning queries. Start routing them.