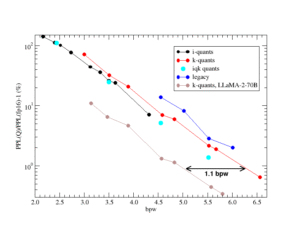
The KV cache compression landscape just got a reality check. After running 75 benchmark pairs on Qwen 3.6 27B, using a specialized llama.cpp fork that supports q8/q6/q5/q4, KVarN, TurboQuant, and TCQ, the results paint a much more nuanced picture than the hype suggests.
If you’ve been following the “TurboQuant revolution” on Reddit, brace yourself. The benchmarks show that rotation, the core trick that made TurboQuant impressive, has been quietly absorbed by standard quantization methods. Meanwhile, KVarN is doing what TurboQuant only promised: shifting the quality-per-memory curve by roughly an entire tier.
The Setup That Matters
The hardware is brutally realistic: a single RTX 3090 with 24 GB VRAM, Ryzen 7 5700X3D, and 32 GB system RAM. The model is Qwen 3.6 27B, a dense model that recently made MoE architectures look fat. The BeeLlama.cpp fork was chosen specifically because it supports the experimental types that standard llama.cpp doesn’t: q6_0, KVarN, TurboQuant, and TCQ.
Two weight quantizations were tested: Q5_K_S and IQ4_XS. The reason is non-obvious: weight precision changes how much cache quantization costs in the tail. Q5_K_S produces richer KV distributions, so quantizing those values loses more signal. IQ4_XS has smoother distributions, so the same cache preset looks safer.
Why Perplexity Is Lying to You
Look at the benchmark perplexity table and every mode looks fine. Even the most aggressive compression barely moves the average:
| Cache | Size vs bf16 | Q5_K_S 64k PPL | Precision vs bf16 |
|---|---|---|---|
| bf16 | 100% | 5.4800 | 100.00% |
| q8_0 | 53.1% | 5.4774 | 100.05% |
| q5_0 | 34.4% | 5.4802 | 100.00% |
| q4_0 | 28.1% | 5.4877 | 99.86% |
| turbo4 | 25.8% | 5.4841 | 99.93% |
| turbo2 | 13.3% | 5.6403 | 97.16% |
Even turbo2 at 13.3% of the bf16 cache only moves PPL by 0.16 absolute. If perplexity were the whole story, you’d compress aggressively and never look back.
But perplexity averages over every token equally. A hallucinated closing brace or a mangled JSON key gets diluted by thousands of unremarkable tokens. The metric that catches the real damage is KL divergence, specifically the 99.9% KLD, which measures the worst 0.1% of positions.
This is where the story changes dramatically.
Rotation Changed Everything
The key insight that most discussions miss: the q4/q5/q8 modes in these benchmarks are not naive scalar quantization. They apply random rotation to KV cache vectors before quantizing, the same trick TurboQuant used to claim superiority. Rotation spreads outlier energy across coordinates, giving scalar quantizers a more uniform distribution to work with.
The difference is what happens after rotation. Standard q4/q5 quantize each value independently with a scalar codebook. TurboQuant quantizes to 2-3 bits with scalar codebook and optionally adds QJL residuals. TCQ constrains index sequences through a trellis.
TurboQuant is also slower. turbo4 runs at ~705 tok/s prefill versus ~850 tok/s for q4_0, a 17% throughput penalty for no quality gain. The rotation overlap means TurboQuant is competing against modes that already benefit from the same smoothing trick.
As one developer succinctly put it on a technical discussion: TurboQuant “gave us rotation implemented in usual quants, which is what makes it look bad now.” The rotation became the standard, and TurboQuant lost its differentiation at 4 bits.
The 99.9% KLD: Where Modes Break
The 99.9% precision column tells the real story, converting tail divergence to a percentage: 100 * exp(-(quantKLD - bf16KLD)).
On Q5_K_S 64k, the 99.9% tail diverges sharply:
| Cache | Size vs bf16 | 99.9% KLD | 99.9% Precision |
|---|---|---|---|
| bf16 | 100.0% | 0.023258 | 100.00% |
| q8_0 | 53.1% | 0.078709 | 94.61% |
| q5_0 | 34.4% | 0.099073 | 92.70% |
| q4_0 | 28.1% | 0.130419 | 89.84% |
| turbo4 | 25.8% | 0.138370 | 89.13% |
| turbo3_tcq | 20.3% | 0.227104 | 81.56% |
| turbo2 | 13.3% | 0.903576 | 41.47% |
The mean KLD still looks reasonable for most modes. But the 99.9% column tells a different story. q5_0 at 34.4% of bf16 has a 99.9% KLD of 0.099, 42× its mean. q4_0 jumps to 0.130, a 32% increase over q5_0 in the tail. This is where tool calls break and JSON outputs hallucinate closing braces.
Below q4_0, the turbo modes fall off a cliff. turbo3_tcq at 20.3% hits 0.227 in the tail. turbo2 at 13.3% hits 0.904, roughly one full nat of divergence at the worst one-in-a-thousand positions. The perplexity table suggested turbo3_tcq was fine. The tail says otherwise.
The Asymmetric Key: Where Bits Should Actually Go
The most useful part of the entire benchmark is the asymmetric K/V rows. They confirm the “K-first” intuition but with a critical limit.
At 31.3% of bf16 KV, q5_0-q4_0 has the same size as symmetric q4_1. Yet it beats q4_1 across all three 99.9% precision tables: 91.39% vs 88.82% on Q5_K_S 64k. Spending the same budget on stronger K and weaker V outperforms splitting bits evenly.
The boundary is clear. When K reaches q5_0, the next useful bit goes to V, not to pushing K to q5_1. The q5_0-q4_1 pair at 32.8% of bf16 costs only 1.5 points more than q5_0-q4_0 and improves the tail from 91.39% to 92.65%.
Drop below q5 on V and you hit a cliff. q6_0-q4_1 drops to 92.19% on Q5_K_S, over a full point below q5 V. q6_0-q4_0 is even easier to reject: same 34.4% footprint as q5_0-q5_0 but worse on all three configurations.
KVarN: The Real Curve Shift
KVarN changes the quality-per-memory curve in a way that TurboQuant never managed. The paper from arXiv 2606.03458 describes a dual-axis variance normalization across both dimensions of a KV tile, combined with Hadamard rotation. In practical terms: ordinary per-axis quantization can preserve one shape of scale variation and still blow up a few token norms. KVarN spends extra metadata on a second scale so quantizer can keep those token magnitudes closer to where they were.
The benchmark results on Q5_K_S 64k are striking:
| Cache | Size vs bf16 | Mean KLD | 99.9% KLD | 99.9% Precision |
|---|---|---|---|---|
| q5_1 | 37.5% | 0.002911 | 0.098354 | 92.77% |
| kvarn4-kvarn4 | 27.9% | 0.002974 | 0.094819 | 93.09% |
| q5_0 | 34.4% | 0.003206 | 0.099073 | 92.70% |
| q4_0 | 28.1% | 0.004711 | 0.130419 | 89.84% |
| kvarn4-kvarn3 | 24.8% | 0.003824 | 0.135028 | 89.42% |
| turbo3_tcq | 20.3% | 0.007978 | 0.227104 | 81.56% |
| kvarn3-kvarn3 | 21.7% | 0.005349 | 0.168135 | 86.51% |
kvarn4-kvarn4 is the headline. It almost matches q5_1 on mean KLD, beats q5_0, and uses less memory than q4_0. The q5_1 edge is real but narrow: 0.002911 versus 0.002974. In exchange, q5_1 uses 37.5% of bf16 while kvarn4-kvarn4 uses 27.9%. For a VRAM-constrained setup, that’s not a practical win for q5_1.
kvarn4-kvarn3 creates a useful tier that didn’t exist before: below q4_0 memory with better quality. It sits between q4_0 and q5_0-q4_0 on tail metrics while using less memory than both.
kvarn3-kvarn3 is the compact sweet spot. At 21.7% of bf16, it cuts the turbo3_tcq mean KLD by a third: 0.005349 vs 0.007978. The tail improves from 0.227104 to 0.168135.
The K/V Matrix: Why Balance Matters
The full 3×3 KLD matrix for KVarN shows why over-investing in K while starving V fails:
| Pair | Size vs bf16 | Mean KLD | 99.9% KLD | 99.9% Precision |
|---|---|---|---|---|
| kvarn3-kvarn4 | 24.8% | 0.004652 | 0.140358 | 88.95% |
| kvarn4-kvarn3 | 24.8% | 0.003824 | 0.135028 | 89.42% |
| kvarn2-kvarn4 | 21.7% | 0.013639 | 0.418240 | 67.37% |
| kvarn3-kvarn3 | 21.7% | 0.005349 | 0.168135 | 86.51% |
| kvarn4-kvarn2 | 21.7% | 0.010449 | 0.340392 | 72.82% |
| kvarn2-kvarn3 | 18.6% | 0.014589 | 0.445014 | 65.59% |
| kvarn3-kvarn2 | 18.6% | 0.011122 | 0.345995 | 72.42% |
At 24.8% memory, kvarn4-kvarn3 crushes kvarn3-kvarn4. Higher K wins. But at 21.7%, kvarn3-kvarn3 destroys both asymmetric extremes. kvarn2-kvarn4 damages K too much, kvarn4-kvarn2 damages V too much.
The practical rule: K can take the extra bit, but V should stay within one bit of K. The useful asymmetric rows are near-balanced.
The Upward Extension: KVarN 5/6/8
The follow-up benchmarks extend KVarN to higher bit widths, and the pattern repeats: KVarN shifts quality down by roughly one memory tier.
kvarn5-kvarn5 is the q6-class proof. On IQ4_XS 64k, it strictly beats q6_0 on both mean and 99.9% KLD while using 34.2% of bf16 instead of 40.6%. On Q5_K_S 64k, the mean loses narrowly but the tail wins.
kvarn6-kvarn6 is the q8-class proof. On Q5_K_S 64k, it’s effectively tied with symmetric q8_0: 0.002338/0.078797 vs 0.002328/0.078709, at 40.4% of bf16 instead of 53.1%.
kvarn8-kvarn8 mostly confirms saturation. It lands in the same q8 band but at q8-sized memory. The value row happened at kvarn6.
The Practical Preset Ladder
The old recommendation set treated TurboQuant too broadly. The new one separates precision modes, fidelity modes, and survival modes. With KVarN included, the ladder looks like this:
| Preset | Size vs bf16 | Quality Class | Use Case |
|---|---|---|---|
| bf16/bf16 | 100.0% | Reference | Blame-isolation, full quality |
| q8_0/q8_0 | 53.1% | Validation | Compression with minimal losses |
| q8_0/q6_0 | 46.9% | High-end | Recommended high-end preset |
| kvarn6-kvarn5 | 37.3% | Aggressive q8 | When kvarn6 misses the fit |
| kvarn5-kvarn5 | 34.2% | q6-class | q6 quality at q5 memory |
| kvarn5-kvarn4 | 31.1% | Mid-tier | Best value per size |
| q5_0/q4_1 | 32.8% | Safe default | Best default if VRAM-constrained |
| kvarn4-kvarn4 | 27.9% | q5-class | q5 quality below q4 memory |
| q4_0/q4_0 | 28.1% | Memory saving | Visible precision loss |
| kvarn4-kvarn3 | 24.8% | Below q4 | Above turbo quality |
| turbo3_tcq | 20.3% | Extreme | Viable extreme compression |
| kvarn2-kvarn2 | 15.4% | Emergency | Last resort |
The f16 vs bf16 Resolution
The follow-up f32-baseline benchmark settles the practical question: bf16 is the better 16-bit default. At the same 2048 MiB at 32k context, bf16/bf16 gets mean KLD 0.013964 while f16/f16 gets 0.014504. The 99.9% tail is much cleaner: 1.798395 vs 2.314729.
The V-side isolation rows confirm it. With K held at f32, f32/bf16 gets 0.012111 mean KLD versus f32/f16 at 0.015022. bf16 wins on both the symmetric and V-only comparisons, with no useful VRAM trade-off and no stable speed penalty in these runs.
(Previous Qwen context window challenges and optimization problems were even more extreme, with Qwen3.5 consuming 3K tokens before the model even started generating. Modern KV cache methods make that problem tractable.)
What TurboQuant’s Supporters Got Wrong
The Reddit thread responses say it best. When one user asked “Am I right that we can finally see visually that TurboQuant gives us nothing?”, the fork author responded: “TurboQuant gave us rotation implemented in usual quants, which is what makes it look bad now.” But another commenter pushed back: “Massive doubt. It existed in exllama and ik_llama before turboquant became a meme.”
The truth lies somewhere in between. Rotation was not invented by TurboQuant, but TurboQuant popularized it for the KV cache. The problem is that the community treated “3.5-bit is 94% as good as BF16” as a generic claim that applied to all workloads. The benchmark data makes it clear: within 1% on average, yes. In the catastrophic tail? No.
When one developer posted about running TurboQuant and getting repeated code corruption in a complex HTML/CSS demo, the response from the fork maintainer was sobering: “KVarN looks like a real frontier shift. The old sub-6-bit recommendation was a ladder of compromises. KVarN rearranges that.”
Weight Quantization Changes Everything
The benchmark ran two weight quantizations: Q5_K_S and IQ4_XS. At 64k context, most symmetric cache modes land 3-5% higher in 99.9% precision on IQ4_XS than on Q5_K_S.
| Cache | Q5_K_S 99.9% | IQ4_XS 99.9% | Gap |
|---|---|---|---|
| q8_0 | 94.61% | 98.69% | +4.08 |
| q5_0 | 92.70% | 97.32% | +4.62 |
| q4_0 | 89.84% | 93.01% | +3.17 |
The raw KLD numbers make the gap sharper. Q5_K_S q8_0 has 99.9% KLD of 0.078709, IQ4_XS q8_0 has 0.017372. Same cache mode, 4.5× the tail damage on higher-precision weights.
The reason: Q5_K_S produces richer KV distributions with more fine detail. When you quantize those values, you lose more because there’s more to lose. KL divergence is measured against each model’s own bf16 baseline, so a Q5_K_S model at q4_0 cache has moved further from its potential than IQ4_XS has from its.
Practical takeaway: the same cache preset is tail-safer on lower-weight-precision models. If running Q5_K_S, lean harder toward q5_0 over q4_0 than you would on IQ4_XS.
The Memory Math
The compression ratios matter most at scale. At 128k context on IQ4_XS, the difference between modes becomes stark:
| Cache | KV cache (MiB) | Memory saved vs bf16 | Use case |
|---|---|---|---|
| bf16 | 8192 | 0% | Reference |
| q8_0 | 4352 | 46.9% | Fidelity tier |
| q5_0 | 2816 | 65.6% | Quality tier |
| q4_0 | 2304 | 71.9% | Memory tier |
| kvarn4-kvarn4 | 2264 | 72.4% | Quality at memory tier |
| turbo3_tcq | 1664 | 79.7% | Extreme compression |
| kvarn3-kvarn3 | 1752 | 78.6% | Better extreme compression |
| kvarn2-kvarn2 | 1240 | 84.9% | Emergency only |
The gap between q4_0 and kvarn4-kvarn4 is only 40 MiB at this scale, but kvarn4-kvarn4 has significantly better tail behavior: 99.9% precision of 97.04% vs 94.34% on IQ4_XS 128k. That’s the difference between “sometimes broken” and “reliable” for long-context generation.
What the Benchmarks Don’t Test
These are Wikitext PPL and KL divergence benchmarks. They are not end-to-end reasoning tasks. The KVarN paper reports near-fp16 behavior on MATH500, AIME24, and HumanEval at 2-bit precision. That can be true at the task-score level while being false at the distribution level. What KVarN does is move errors into less damaging shapes.
Multiple-choice benchmarks (ARC, HellaSwag, MMLU) all run at short context under 10K tokens. The KV cache is tiny at those lengths, and every cache mode scores within noise. They confirm the model still speaks English, which was never in doubt.
Synthetic passkey and needle-in-a-haystack retrieval at 32K context scored 100% for every cache type, including turbo2. Retrieval of a single attended token is a different failure mode than slowly diverging output distributions over thousands of tokens.
JSON schema generation also hit 100% for all cache types. Cache quantization does not break template compliance at the scale tested.
The specialized llama.cpp backend optimized for Qwen 3.6 achieved 72.9 tok/s on 24GB VRAM, proving that these quantization techniques have real-world throughput benefits beyond the numbers in the benchmark tables.
The benchmark does not show “Q beats TQ” or “TQ beats Q.” It shows that the line between them has moved. Rotation made ordinary q4/q5 quite decent. TCQ makes very low-bit turbo modes more viable. KVarN shifts the practical ladder down by roughly one memory tier.
TurboQuant’s niche has narrowed to 2-3 bit scenarios where TCQ variants are not available. Even there, kvarn3-kvarn3 provides a better alternative at similar memory cost.
For the practical engineer:
- If quality matters most: q8_0/q6_0 or kvarn6-kvarn6
- If VRAM is tight: kvarn5-kvarn4 or q5_0/q4_1
- If VRAM is critical: kvarn4-kvarn4
- If you need extreme compression: kvarn3-kvarn3
- Only if you’re desperate: turbo2_tcq (and don’t use it for code, JSON, math, or tool calls)
The era of declaring “TurboQuant is lossless!” based on perplexity alone is over. The tail knows better.