Enterprise Data Chaos: When Your PowerBI Teams Outrun (and Outgun) Governance

First, the PowerBI team, an established fiefdom long before they arrived, shows them their “semantic layer.” It’s an SSAS tabular model with a staggering 50+ calendar tables. Each table contains the same data, but sports different column names. Their justification? “It was easier than renaming objects in PowerBI.”
Next, they face the demand to double-count transaction rows to support Canadian business: duplicate every fct_order entry, one in USD, one in CAD, so users can filter by a currency column. The data engineer’s counter-proposal, an exchange rate column, is flatly rejected. This mangled fact table is non-additive without a filter.
Finally, the new “Architecture Department”, a freshly-minted team who draws “data patterns” in Visio, presents their grand design. When asked for a proof-of-concept on the expensive, unproven enterprise tools they purchased, the reply is a shrug: “You figure it out.”
This isn’t a dystopian IT novel. A snapshot of the brutal, everyday reality of Enterprise Data Chaos. Welcome to the front lines of a quiet war, where self-service BI teams, moving at consumer-product velocity, have decisively outrun slow, centralized, top-down architecture governance.
The Battle Lines: Invisible Gold Layers and Rubber-Stamp Architecture
The data engineer’s plea described a classic standoff. The PowerBI team had been happily building what developers call an “invisible gold layer.” As one commenter on r/dataengineering noted, “Power bi ppl need to learn SQL and data engineering team needs to centralize the data for them.” But the problem goes deeper than SQL proficiency.
The PowerBI team’s philosophy is pragmatic and born of necessity. Faced with a rigid, slow-moving central IT, they built their own shadow model. They bypassed the “gold” data warehouse layer entirely, preferring to consume the “silver” (raw or staged) data and build their “gold” logic hidden inside the BI tool.
The commenter nailed the risk: “That way only dashboards have access to gold data and then your baked data is held hostage to that bi tool.”
This is the crucial friction point. The centralized data team’s core mission, creating a canonical, governed, single source of truth, is directly at odds with the BI team’s need for speed and autonomy. One PowerBI user summarized the counterargument perfectly: “It takes months and thousands of dollars to get new fields from the ERP added to the gold layer… I just want to do my job but do not have the time to wait months and go to 12 meetings about a project I can do myself in PBI in two days.”
The central team sees a sprawling, unmaintainable mess. The BI team sees a stifling, bureaucratic bottleneck.
Then there’s the “Architecture Team.” This new department, armed with Visio, appears to exist in a vacuum. They design abstract patterns devoid of implementation risk or technical feasibility. They create process without proof. This failure isn’t a lack of a plan, it’s a failure to connect architectural intent with engineering reality. The data team is left holding a high-level diagram, expected to “figure it out”, while the actual governance needed to wrangle the PowerBI chaos is absent.
The Cognitive Chasm: Why BI Users and Engineers See Different Worlds
Why does this happen? The core issue is a vast cognitive chasm between how architectural governance sees data and how analysts use it.
The Governance Mindset
- Sees data as an asset requiring structure, lineage, and consistency
- Engineers think in facts, dimensions, and slowly-changing Type 2 dimensions
- Want clean, additive fact tables and normalized dimensions
The PowerBI Mindset
- Sees data as a medium for insight and answers
- Analysts think in filters, slicers, and visualizations
- The request for 50 calendar tables wasn’t laziness—it’s a user experience problem
The Hidden Cost
- Renaming columns in PowerBI is a manual, report-breaking process
- They chose duplication over fragility
- Solving UX problems with data model hacks
The CAD/USD doubling request reveals an even deeper misunderstanding of core data modeling principles. The BI team wanted a single filter to swap the entire report’s currency. Their solution, duplicating rows, seems insane to a data engineer because it violates the fundamental rule of a fact table: it should be additive.
This isn’t malice, it’s a symptom of a team operating without architectural guardrails. This is the classic case of a tool being used far beyond its intended scope. As another commenter observed, “Doing heavy modelling inside BI presentation tools is such an anti pattern.” But it’s an anti-pattern that thrives where the official “pattern” is too slow or unresponsive to deliver what the business needs.
The Silent Killer: Governance Failure by Omission
The real story isn’t about rogue BI teams. It’s about the complete failure of enterprise governance to adapt to the age of self-service analytics.
Traditional governance, manifest as the cumbersome Cognos era, was about centralized control. IBM Cognos offered ironclad governance, but at the cost of flexibility and speed. Modern tools like PowerBI flipped the script, democratizing access.
But enterprises transplanted old governance models, waterfall-style, IT-led, documentation-heavy, onto this new agile landscape. It doesn’t work. The result? Companies swing between two extremes: stifling control, or the anarchic sprawl described by our data engineer.
There is no middle ground because most governance frameworks are designed for the Cognos era. They focus on preventing bad things rather than enabling good things.
The most telling comment came from another Senior Data Manager advocating for a “RACI matrix” and “cross-functional data governance” sponsored at the executive level. This is the missing piece: governance must be a collaborative contract, not an imposed edict.
When governance policies are weak or misaligned, anxiety permeates decision-making. Leadership becomes hesitant to deploy advanced capabilities like PowerBI’s AI features, fearing the chaos they’ll exacerbate. As research notes, Power BI AI fails without solid architecture.
The Path Forward: From Control Towers to Federated Guardrails
This isn’t a problem you solve by hiring more architects or firing your PowerBI team. It’s solved by rethinking governance from the ground up. You need to shift from a control tower model to one of federated guardrails.
-
Bring the ‘Gold’ into Governance (Make it Frictionless)
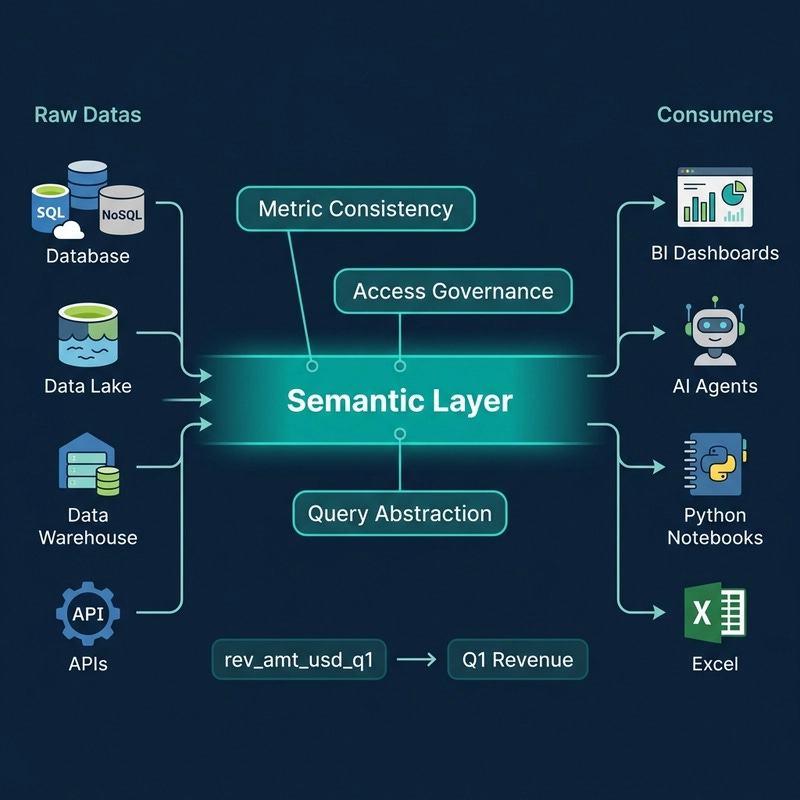
The goal isn’t to stop the BI team’s modeling. It’s to move that modeling into a governed, shared space. This is the domain of the “semantic layer.” The semantic layer sits between raw data sources and consumers, providing metric consistency, access governance, and query abstraction.
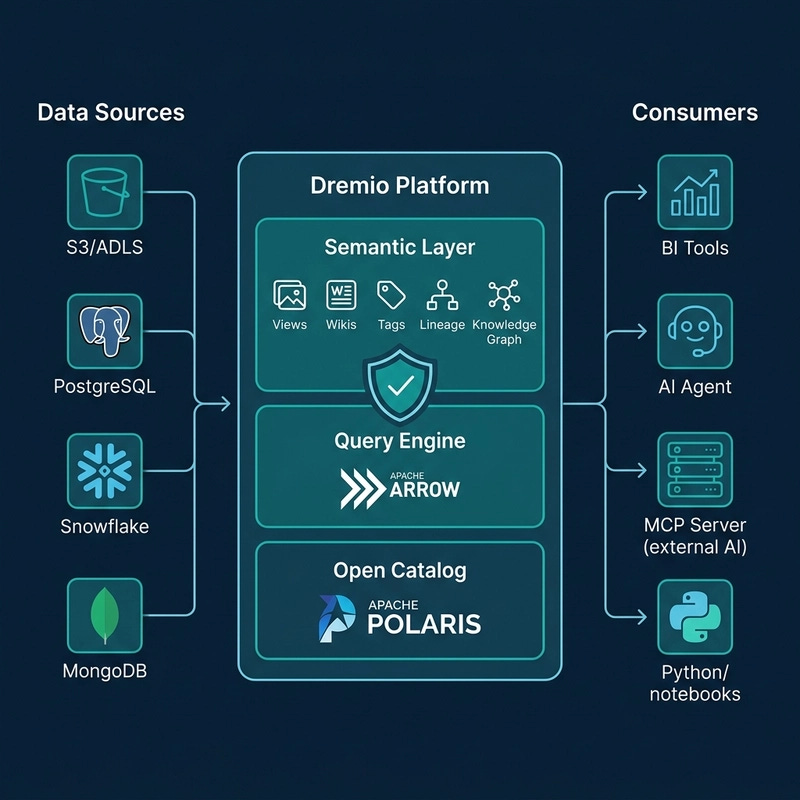
Modern implementations like dbt’s Semantic Layer or Dremio’s AI Semantic Layer let teams define metrics (like “Active Customer”, “Revenue”) as code or in a governed catalog. “Moving metric definitions out of the BI layer and into the modeling layer allows data teams to feel confident that different business units are working from the same metric definitions,” regardless of their tool.
This is the ultimate solution to the “50 calendar tables” problem, define “Calendar” once, properly, and enforce it. For enterprises managing polyglot data stacks, avoiding architectural false dichotomies is key when choosing the right semantic layer strategy.
-
Architecture That Serves, Not Dictates
The Architecture Team needs to pivot. Their Visio diagrams are worthless. Their job must become enabling viability. They should be conducting feasibility tests, running budget-constrained POCs, and establishing those reusable patterns before any engineer is asked to “figure it out” at scale.
This is the core lesson of transitioning from startup agility to enterprise governance: governance must evolve to serve scale, not just enforce restrictions.
-
Establish the Cross-Functional Governance Council
This requires executive sponsorship. A Data Governance Council with seats for the lead Data Engineer, the PowerBI Manager, and key business stakeholders. The council’s first agenda item? Resolving the CAD/USD issue. Its second? Ratifying a single, canonical calendar dimension.
The council owns the RACI matrix for those 50+ tables: who is Responsible, Accountable, Consulted, and Informed for changes? The answer cannot be “the PowerBI team in their invisible model.”
AI agents do not have tribal knowledge. Without explicit, machine-readable business logic, they infer meaning probabilistically—a disaster for regulated industries.
The Execution Imperative
Fast-Track Access
Create a rapid, SLA-bound process for the BI team to request and receive new curated fields in the warehouse. Kill the “12 meetings” bottleneck.
Codify Standards
Use a semantic layer tool or a strict dbt + CI/CD process to stop the creation of divergent metrics. This “centralized data layer” is where the enterprise standard lives—but it must be accessible.
Mandate Visibility
Any data product, be it a Snowflake view or a PowerBI dataset, must be registered in a data catalog with clear ownership, lineage, and definitions (an active metadata layer).
Audit Proactively
Use lineage tools to find the invisible gold models and bring them into the light. Sunset them by providing a better, faster, governed alternative.
The lesson from the trenches is stark: you cannot govern data by slowing it down. The PowerBI team will win every time because they are closer to the business need. The only sustainable governance is one that moves at their speed, enabling, not blocking, and ensuring that the path of least resistance is also the path of greatest integrity.
Otherwise, you’re left with exactly what that data engineer described: a brand-new Snowflake data warehouse that nobody wants to use, and a request to essentially rebuild the chaotic on-prem SSAS model in the cloud. It’s a perfect, expensive stalemate born from the unintended consequences of democratizing data access.
Real change starts by addressing the organizational friction, not just the technical debt. The real battle isn’t in the data warehouse—it’s in the meeting rooms where architecture and agility collide.