The responses you’ll get range from “first commit, obviously” to “we’ll add it when we have problems.” Both are wrong in ways that will cost you months of engineering time and more than a few sleepless on-call rotations. The timing of telemetry implementation is one of those seemingly mundane decisions that quietly determines whether your team spends its energy building features or fighting fires.
The research confirms what many senior engineers have suspected: the debate is alive and contentious. A recent Reddit discussion in r/softwarearchitecture saw developers openly wrestling with this exact dilemma. One experienced engineer put it bluntly, observability is “often neglected in the sense of engineers putting it on as a sticker, and not considering the value of what is added.” Another noted they wait until “past the 80% mark” before adding dedicated tooling, relying on log statements early on. The signal is clear: there’s no consensus, and the cost of getting it wrong is steep.
The Two Failure Modes of Telemetry Timing
Let’s state the obvious upfront: you can screw this up in two completely opposite directions.
Too early: You spend sprint after sprint building elaborate dashboards, tracing infrastructure, and metric pipelines for a system that’s still undergoing fundamental architectural changes. The code you wrote last week gets rewritten this week, and your carefully crafted instrumentation now measures behavior that no longer exists. Worse, your team develops a false sense of security, the dashboards look green, but they’re monitoring the wrong things.
Too late: You hit production with zero visibility into what’s actually happening. A customer reports an issue. Your team spends six hours reproducing it locally. You add a log statement, deploy, wait, and repeat. Meanwhile, your SLOs are burning and your users are finding alternative products.
The cost function isn’t symmetrical either. Getting it right early costs you wasted engineering cycles. Getting it wrong late costs you customers and credibility. The asymmetric nature of this risk is why most teams lean toward early implementation, but that instinct has its own hidden costs.
Why “Just Add It Later” Is a Dangerous Fallacy
The argument for waiting sounds reasonable enough: “Our architecture is still evolving. Instrumentation code will just add churn. We’ll add it when we have paying customers.” This logic is seductive because it’s partially true. Early-stage codebases do change rapidly. Instrumentation does add maintenance overhead.
But here’s the problem that breaks the argument: you don’t know what you don’t know. Once you’re in production without telemetry, you’re flying blind. Every debugging session becomes an archaeological dig. You’re trying to reconstruct past events from incomplete artifacts, and the reconstructions are almost always wrong.
The OpenTelemetry documentation captures this tension perfectly: manual instrumentation requires “owning the whole telemetry lifecycle”, marking start and end times, propagating context, adding attributes. That’s heavy. But the alternative, no instrumentation at all, means you’re debugging with a blindfold on.
What most teams miss is the middle ground: auto-instrumentation. The Java auto-instrumentation agent, for example, attaches at runtime and generates spans for HTTP requests, JDBC queries, gRPC calls, and Kafka messaging without any code changes. One engineer’s simple startup modification:
java -javaagent:opentelemetry-javaagent.jar \
     -Dotel.service.name=todo-service \
     -Dotel.exporter.otlp.endpoint=http://otel-collector:4317 \
     -jar my-app.jar
That’s it. Zero code changes. You get distributed tracing the moment your process starts. This shifts the calculus dramatically, you’re no longer choosing between “no telemetry” and “heavy instrumentation.” You can have baseline observability with negligible effort and add depth where it matters.
The 80% Rule: A Pragmatic Middle Path
The Reddit thread revealed a pattern that’s worth examining more closely: the 80% heuristic. The idea is simple, spend the first 80% of your development cycle with lightweight logging, then instrument seriously in the final stretch before production.
This works because early development is inherently exploratory. You’re still figuring out what the system should do, let alone what you need to measure. Log statements are cheap, flexible, and disposable. They give you enough signal to debug during development without committing to an observability architecture that will need constant revision.
But “80%” isn’t a fixed point on a calendar, it’s a judgment call. The right signal is when your API surface stabilizes. When you stop adding endpoints every week and start optimizing the ones you have, that’s your trigger. Your service boundaries are roughly set. Your data flow is predictable. The things you need to measure are unlikely to disappear next sprint.
This is also the moment when how OpenTelemetry’s logging patterns expose gaps in distributed observability becomes relevant. Once your service boundaries are stable, the hidden coupling between services becomes the thing that will actually hurt you in production.
What “Good Enough” Telemetry Looks Like
The goal isn’t perfect observability, that doesn’t exist. The goal is enough signal to answer the three questions that matter in any incident:
- Is the system healthy right now? (Metrics)
- What changed recently? (Logs + deployment tracking)
- Where exactly is the bottleneck? (Traces)
For most teams, this means starting with a simple three-layer approach based on what Google Cloud Observability describes as the core telemetry signals: metric data, log data, and trace data.
Google’s documentation defines observability as “a comprehensive approach to collecting and analyzing telemetry data to help you understand the state of your applications, including agentic applications, and their operating environment.” That’s the right framing, telemetry isn’t an end in itself. It’s the foundation for understanding, not the understanding itself.
The practical question is how much of each signal you need at each stage. Early on, metrics from your platform (CPU, memory, request rates) plus basic HTTP status code logging cover 90% of scenarios. Traces can wait until you’re debugging specific latency issues or investigating distributed failures. The mistake is trying to build the full observability stack before you’ve shipped anything.
The Hidden Cost of Under-Instrumentation
There’s an asymmetry in telemetry timing that most teams don’t appreciate until they’ve been burned: the cost of missing data compounds. A single missing trace in a request chain doesn’t just mean you can’t see that one call, it corrupts the entire trace, making every other span harder to interpret because you’re missing context.
This propagation failure is subtle. You might see that your API response time went from 200ms to 2 seconds, but without complete traces, you can’t determine whether the issue is in your service, your database, or an upstream dependency. The diagnostic value of your entire observability stack collapses because the one gap makes everything else ambiguous.
The role of observability in accelerating the OODA loop for software teams is precisely about closing this feedback gap. Every gap in your telemetry introduces delay between what’s happening in production and what your team can perceive. Those delays add up.
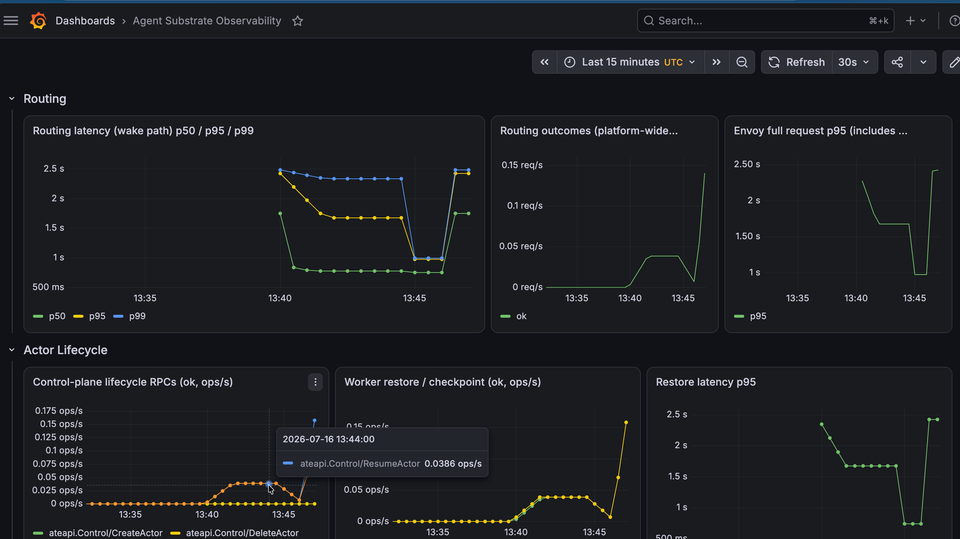
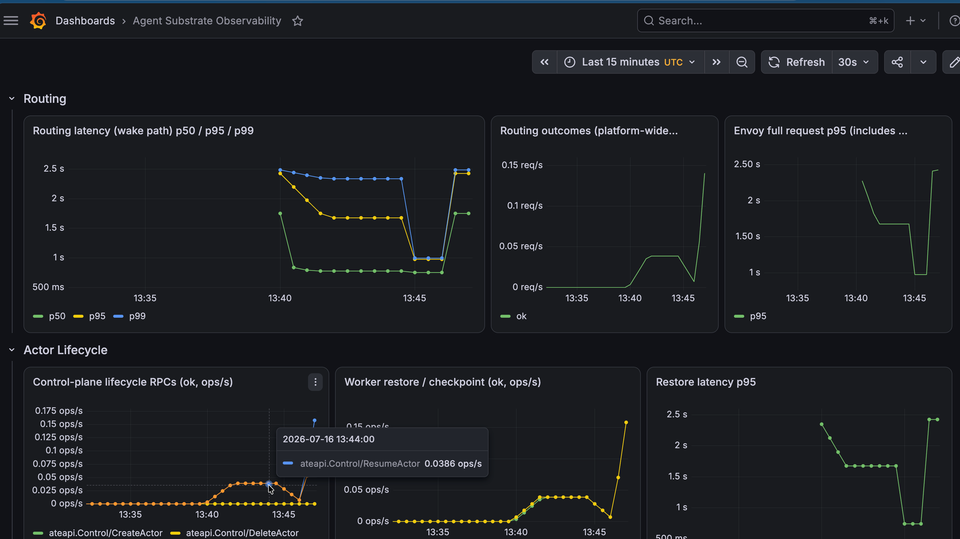
This is also why platforms like Agent Substrate specifically build observability into their actor model. The implementation of observability for Agent Substrate actors demonstrates how even sandboxed agent execution environments can be instrumented to expose routing latency, actor lifecycle events, and snapshot sizes. When the platform emits these signals by default, developers get visibility without the overhead of manual instrumentation.
The OpenTelemetry Operator: Making Timing Irrelevant
The most interesting development in the telemetry timing debate isn’t a better heuristic, it’s tooling that makes the timing question less important. The OpenTelemetry Operator for Kubernetes, along with approaches like high-volume telemetry streaming and observability at scale, shifts the burden from application developers to platform engineers.
Instead of each service team deciding when to instrument, the platform team defines the instrumentation strategy once as a Kubernetes resource:
apiVersion: opentelemetry.io/v1alpha1
kind: Instrumentation
metadata:
  name: instrumentation
  namespace: opentelemetry
spec:
  exporter:
    endpoint: http://otel-collector:4317
  propagators:
    - tracecontext
    - baggage
  sampler:
    type: always_on
Any pod annotated with instrumentation.opentelemetry.io/inject-java: "true" gets the agent injected automatically, no Dockerfile changes, no wrapper scripts, no runtime surprises. This changes the entire discussion. When the platform handles injection, “when should we add telemetry?” becomes “never, it’s already there.”
This approach doesn’t eliminate the need for thoughtful instrumentation, but it eliminates the timing risk. Baseline telemetry is present from deployment one. Teams can then layer on how centralized orchestration creates blind spots that telemetry must resolve and business-specific enrichment as their understanding of what matters evolves.
The Hybrid Enrichment Model
The real magic happens when you combine auto-instrumentation with targeted manual enrichment. The OpenTelemetry Java agent handles the technical plumbing, spans for HTTP calls, database queries, message brokers. Your application code adds the business context:
Span.current().setAttribute("validation.containsProfanity", containsProfanity);
Span.current().setAttribute("validation.todoLength", todo.getName().length());
These two lines come from a real validation service in an example todo application. They add zero technical overhead, the agent already created the span. All the application does is attach meaning. Now your observability system can answer questions like “how many todos were rejected due to profanity?” and “do longer todos take longer to validate?”
This is the sweet spot. You get the safety net of automatic instrumentation from day one, but you only pay the maintenance cost on the enrichments that actually drive decisions. Everything else is handled by the platform.
When Manual Instrumentation Makes Sense (Despite Everything)
Before you conclude that auto-instrumentation solves every timing problem, let’s be clear about its limits. The agent instruments known libraries and frameworks, JDBC, HTTP clients, Kafka consumers, servlet containers. It has no understanding of your domain logic. It doesn’t know which users are VIPs, which operations are customer-facing, or which database queries are critical path.
If you’re building middleware, SDKs, or custom protocols, auto-instrumentation won’t cover you. The spans it creates are technically accurate but semantically empty. You’ll know that a request happened, but not why it mattered.
This is where the framework-specific integration notes matter. Teams using AI-driven development velocity and its impact on observability demands frameworks like Spring Boot, Quarkus, or Micronaut need to check for conflicts between the Java agent and native OpenTelemetry support. Quarkus explicitly states: “The use of the OpenTelemetry Agent is not needed nor recommended.” Double-instrumentation creates broken traces and duplicated spans.
The rule is simple: if your framework already instruments your app, don’t double up. Use the framework’s native integration and supplement with manual enrichment where business context is needed.
The Decision Framework
After all the nuance, here’s the practical framework for deciding when to implement telemetry:
Phase 1, Prototype: Zero instrumentation. Logs only. You’re exploring. Instrumentation would add churn without clarity on what matters.
Phase 2, Product validation: Add auto-instrumentation if possible (OpenTelemetry agent, cloud-native tooling). If not, basic HTTP metrics and error logging. The goal is to know if the system is alive and responding.
Phase 3, Production launch: Full observability stack. Automated traces, structured logging, custom dashboards, alerting on business metrics. This is when the 80% rule kicks in, instrument before you onboard real users.
Phase 4, Scale: Platform-managed instrumentation via operators. Automatic enrichment from service mesh and infrastructure layers. Business-specific span attributes for decision-critical paths.
The threshold between phases isn’t about time, it’s about risk. The moment an outage would cost you real money, real users, or real credibility, you need telemetry. Not after. Before.
The telemetry timing debate isn’t really about technology. It’s about organizational maturity. Teams that have been burned by production outages without visibility tend to over-instrument. Teams that have wasted months maintaining dashboards nobody uses tend to under-instrument. Both reactions are emotional, not rational.
The right answer is boring but true: implement enough telemetry to answer the questions you know you’ll ask, and make it easy to add more later. Auto-instrumentation and platform-managed injection make this practical. The debate about timing only matters when instrumentation is expensive. OpenTelemetry has made it cheap.
The teams that get this right aren’t the ones with the most sophisticated dashboards or the most traces per request. They’re the ones who can look at a production incident and, within minutes, know exactly where to look. That’s the only metric that matters. Everything else is just data.