Last Friday, someone ran three of the world’s best AI models through a gauntlet of 17 progressively harder coding challenges, watched the live results for six hours, and discovered something unsettling: the “smartest” model cleared exactly 4 out of 17 checkpoints. None of them finished a single problem without defects.
The benchmark is SlopCodeBench, a new long-horizon coding evaluation from Gabe Orlanski’s lab at UW Madison. The model is Claude Opus 5, fresh off Anthropic’s press page. And the results tell a story that the usual leaderboard benchmarks don’t: these models are still terrible at the one thing that actually matters in production software engineering.
The Benchmark That Doesn’t Cheat
Most coding benchmarks have a fundamental flaw: they disclose the entire problem up front. SWE-bench gives you a GitHub issue and a codebase. LiveCodeBench hands you a LeetCode problem. There’s no reason for the model to optimize for “is this code easy to change later” because the spec never changes.
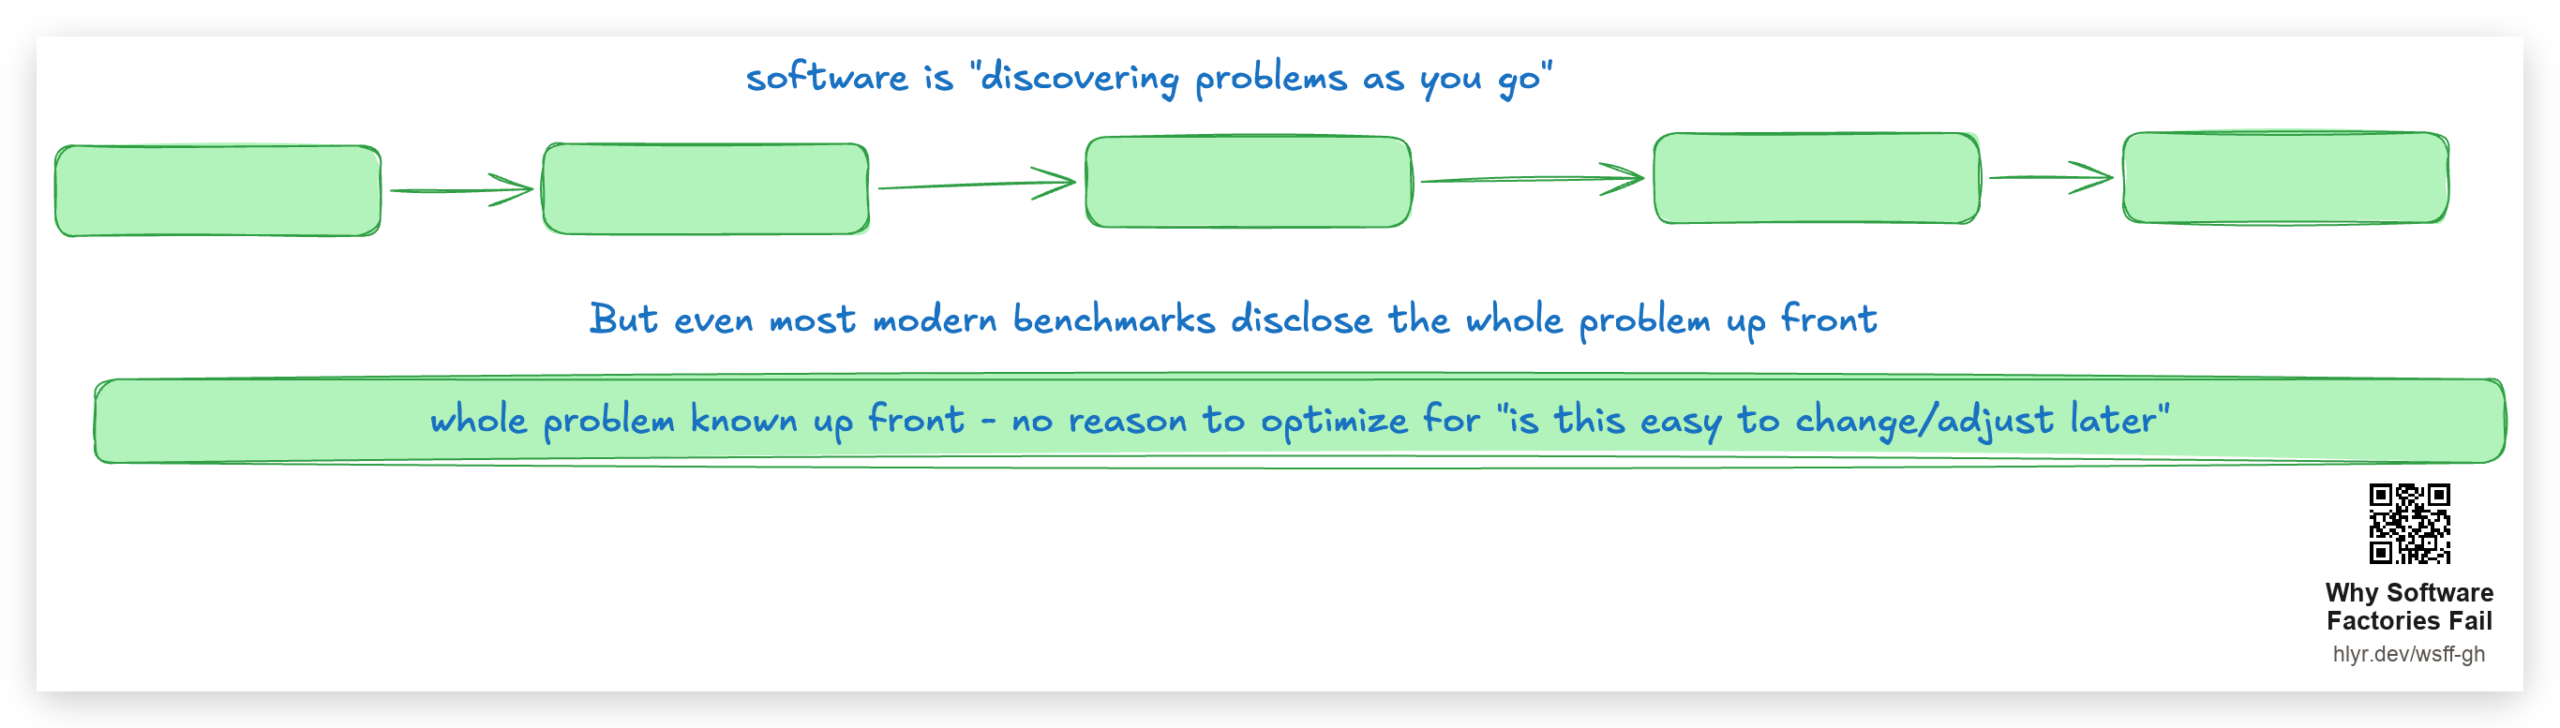
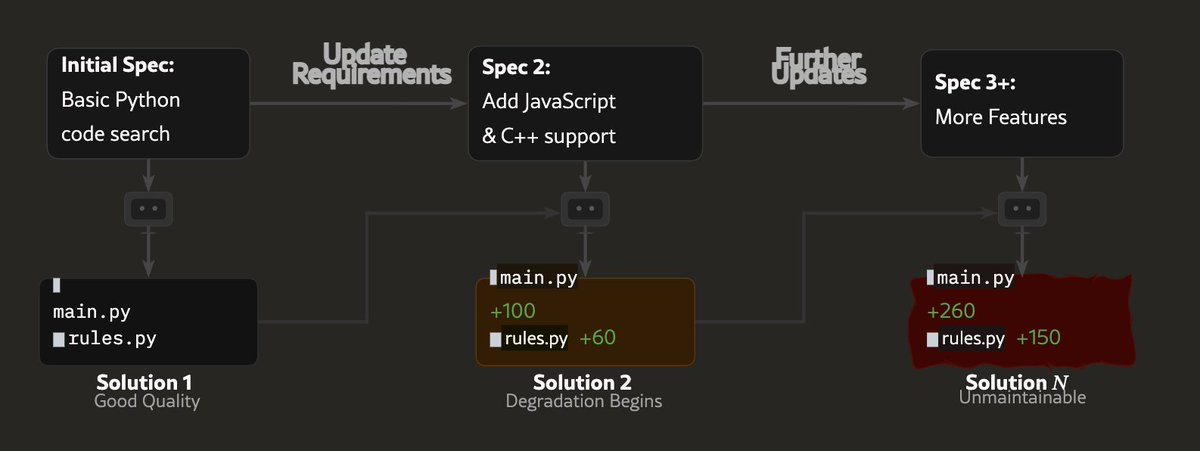
SlopCodeBench fixes this. Each challenge has multiple “checkpoints”, the model doesn’t know the full spec upfront. It has to evolve the codebase over time as new requirements are divulged. The strict pass criteria means every regression test from every previous checkpoint must still pass. If you bungle something in checkpoint 4, you fail checkpoints 5 through 8 unless you happen to accidentally fix it later (spoiler: nobody did).
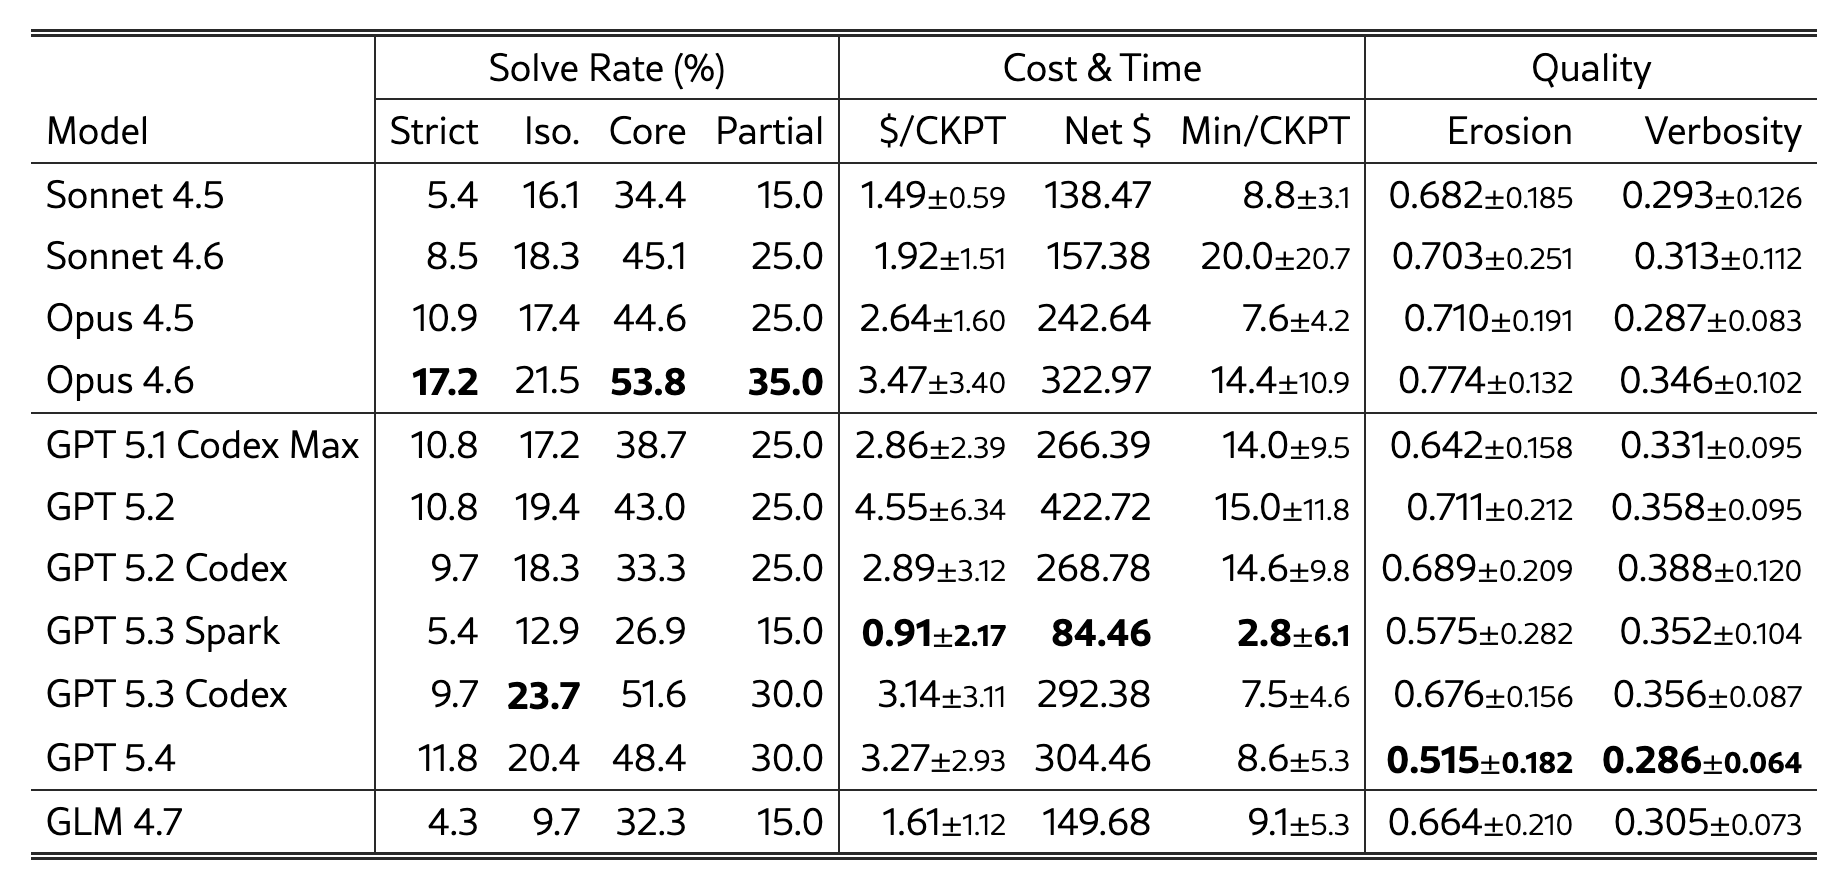
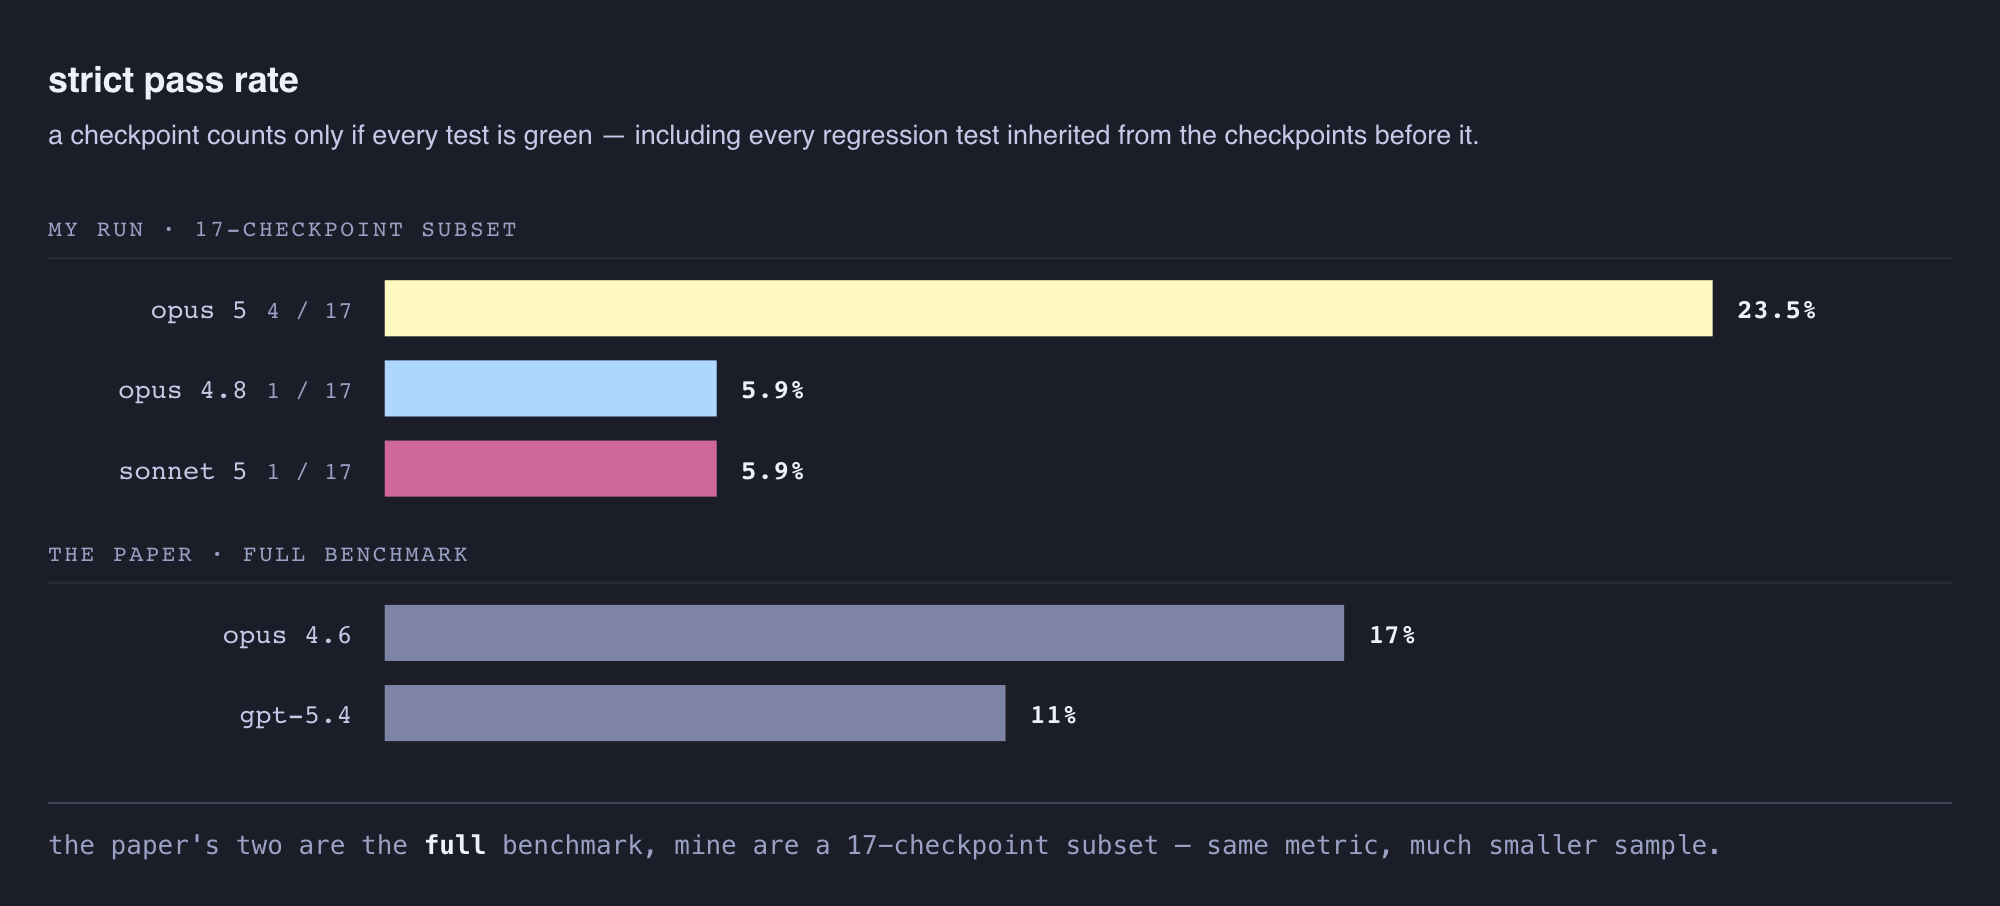
The benchmark was unsaturated on release. The best models available, GPT-5.4 and Opus 4.6, managed 11% and 17% strict pass rates respectively.
The Six-Hour Burn
The benchmark runner tested three Claude models (Opus 4.8, Sonnet 5, and Opus 5) across three problems totaling 17 checkpoints: a “easy” circuit simulator (8 checkpoints), a “medium” database migration tool (5 checkpoints), and a “hard” dynamic config service API (4 checkpoints). Each model got a fresh context window per checkpoint, all using the same prompts in the Claude Code harness.
The mechanic is brutal: model writes code for ck1, eval harness runs black-box tests. Model writes code for ck2, eval runs tests for ck1 and ck2. If checkpoint 4 breaks something from checkpoint 1, every subsequent checkpoint also fails.
Opus 5 won the technical battle, 24% strict pass rate against 6% for both Opus 4.8 and Sonnet 5. But the “winning” model cleared 4 of 17 checkpoints, and three of those were the opening checkpoints of one problem. For the first two hours, Opus 5 was the only model with any strict passes at all, acing the first three checkpoints of the circuit simulator. Then reality set in.
The Defect Trajectory Tells the Real Story
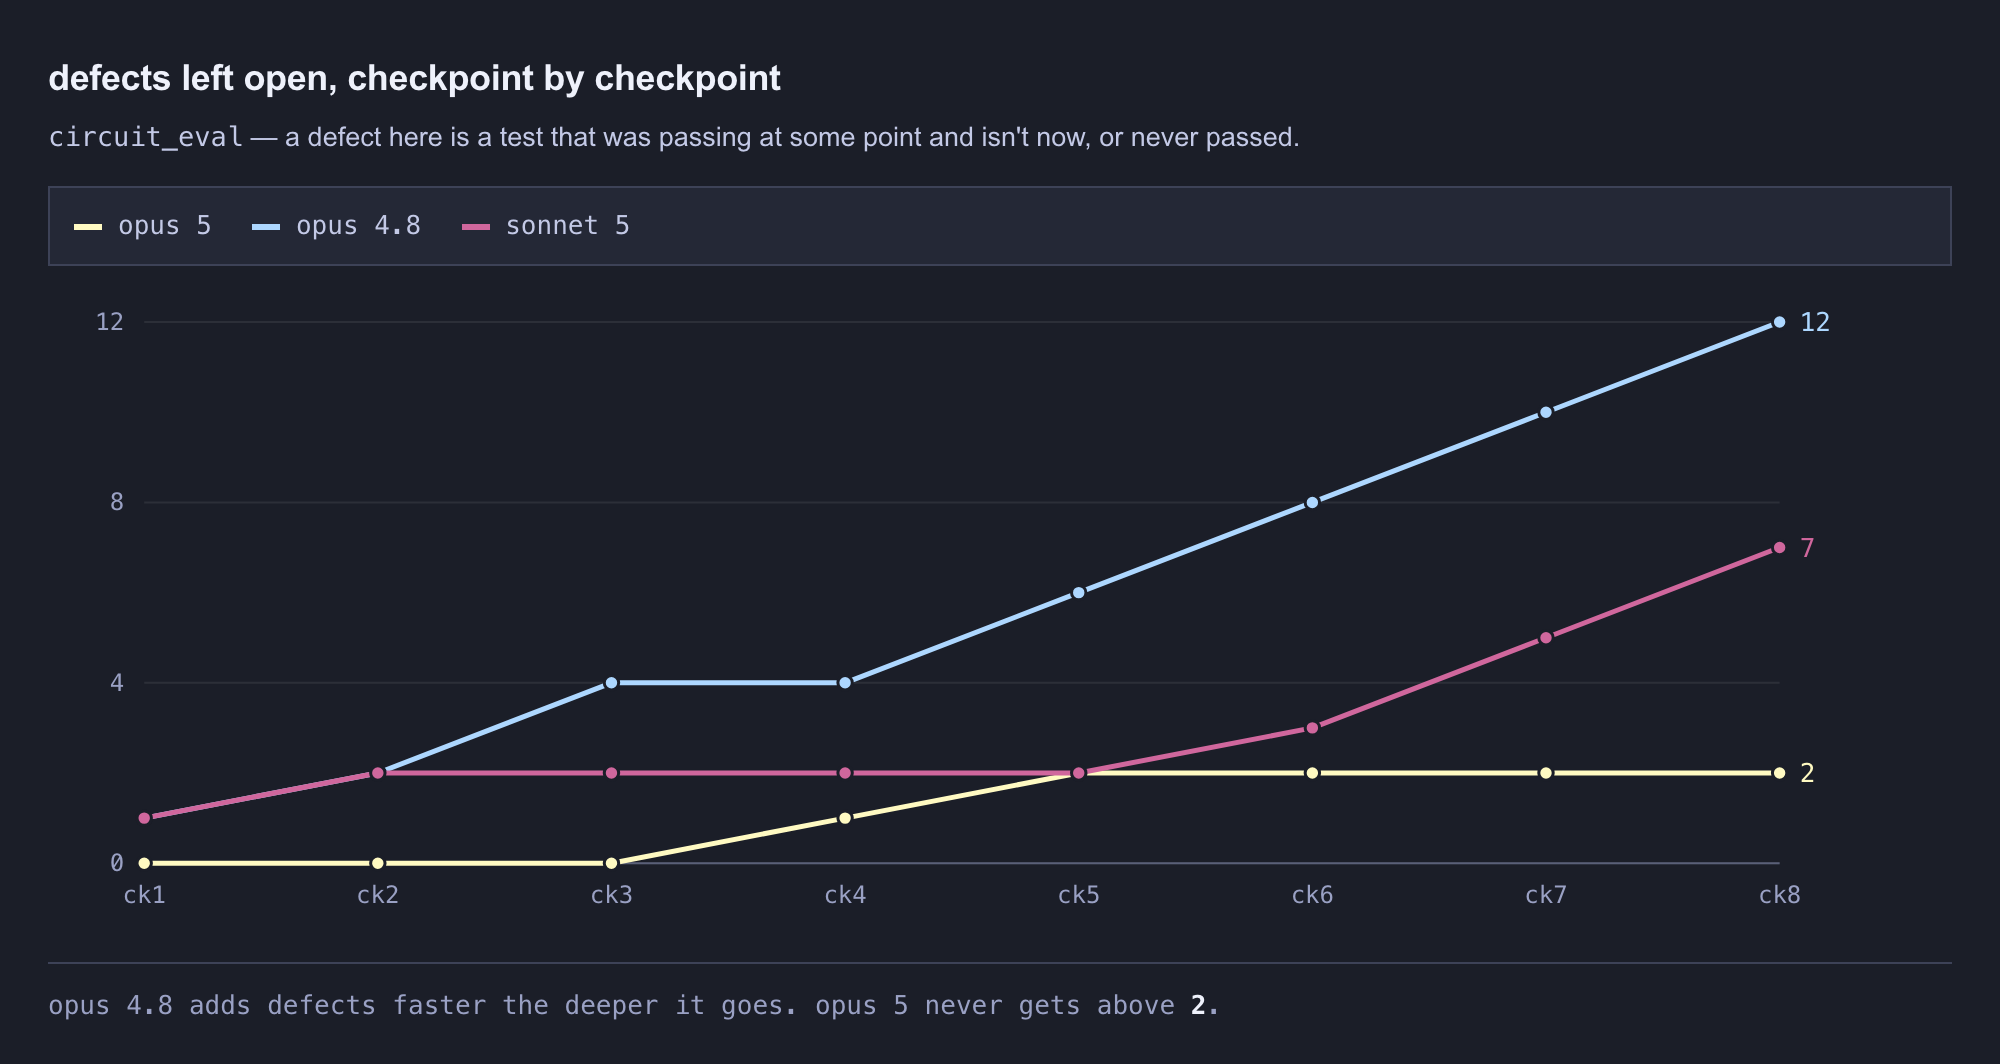
The most revealing chart isn’t the final pass rate, it’s the defect trajectory over time. On the circuit_eval problem, Opus 4.8 accumulated defects from checkpoint 1 like a leaky bucket, climbing from 1 to 10. Sonnet 5 stayed flat with a low but persistent defect count. Opus 5 opened with four clean checkpoints, then defects appeared at checkpoints 4 and 5 and never went away.
This pattern maps directly onto what happens in real agentic coding workflows. The model builds a clean initial architecture. Then the requirements shift slightly, signals go from single bits to vectors, or two-valued logic becomes three-valued, and the original design buckles. The model patches over the cracks instead of refactoring, and each patch makes the next change harder.
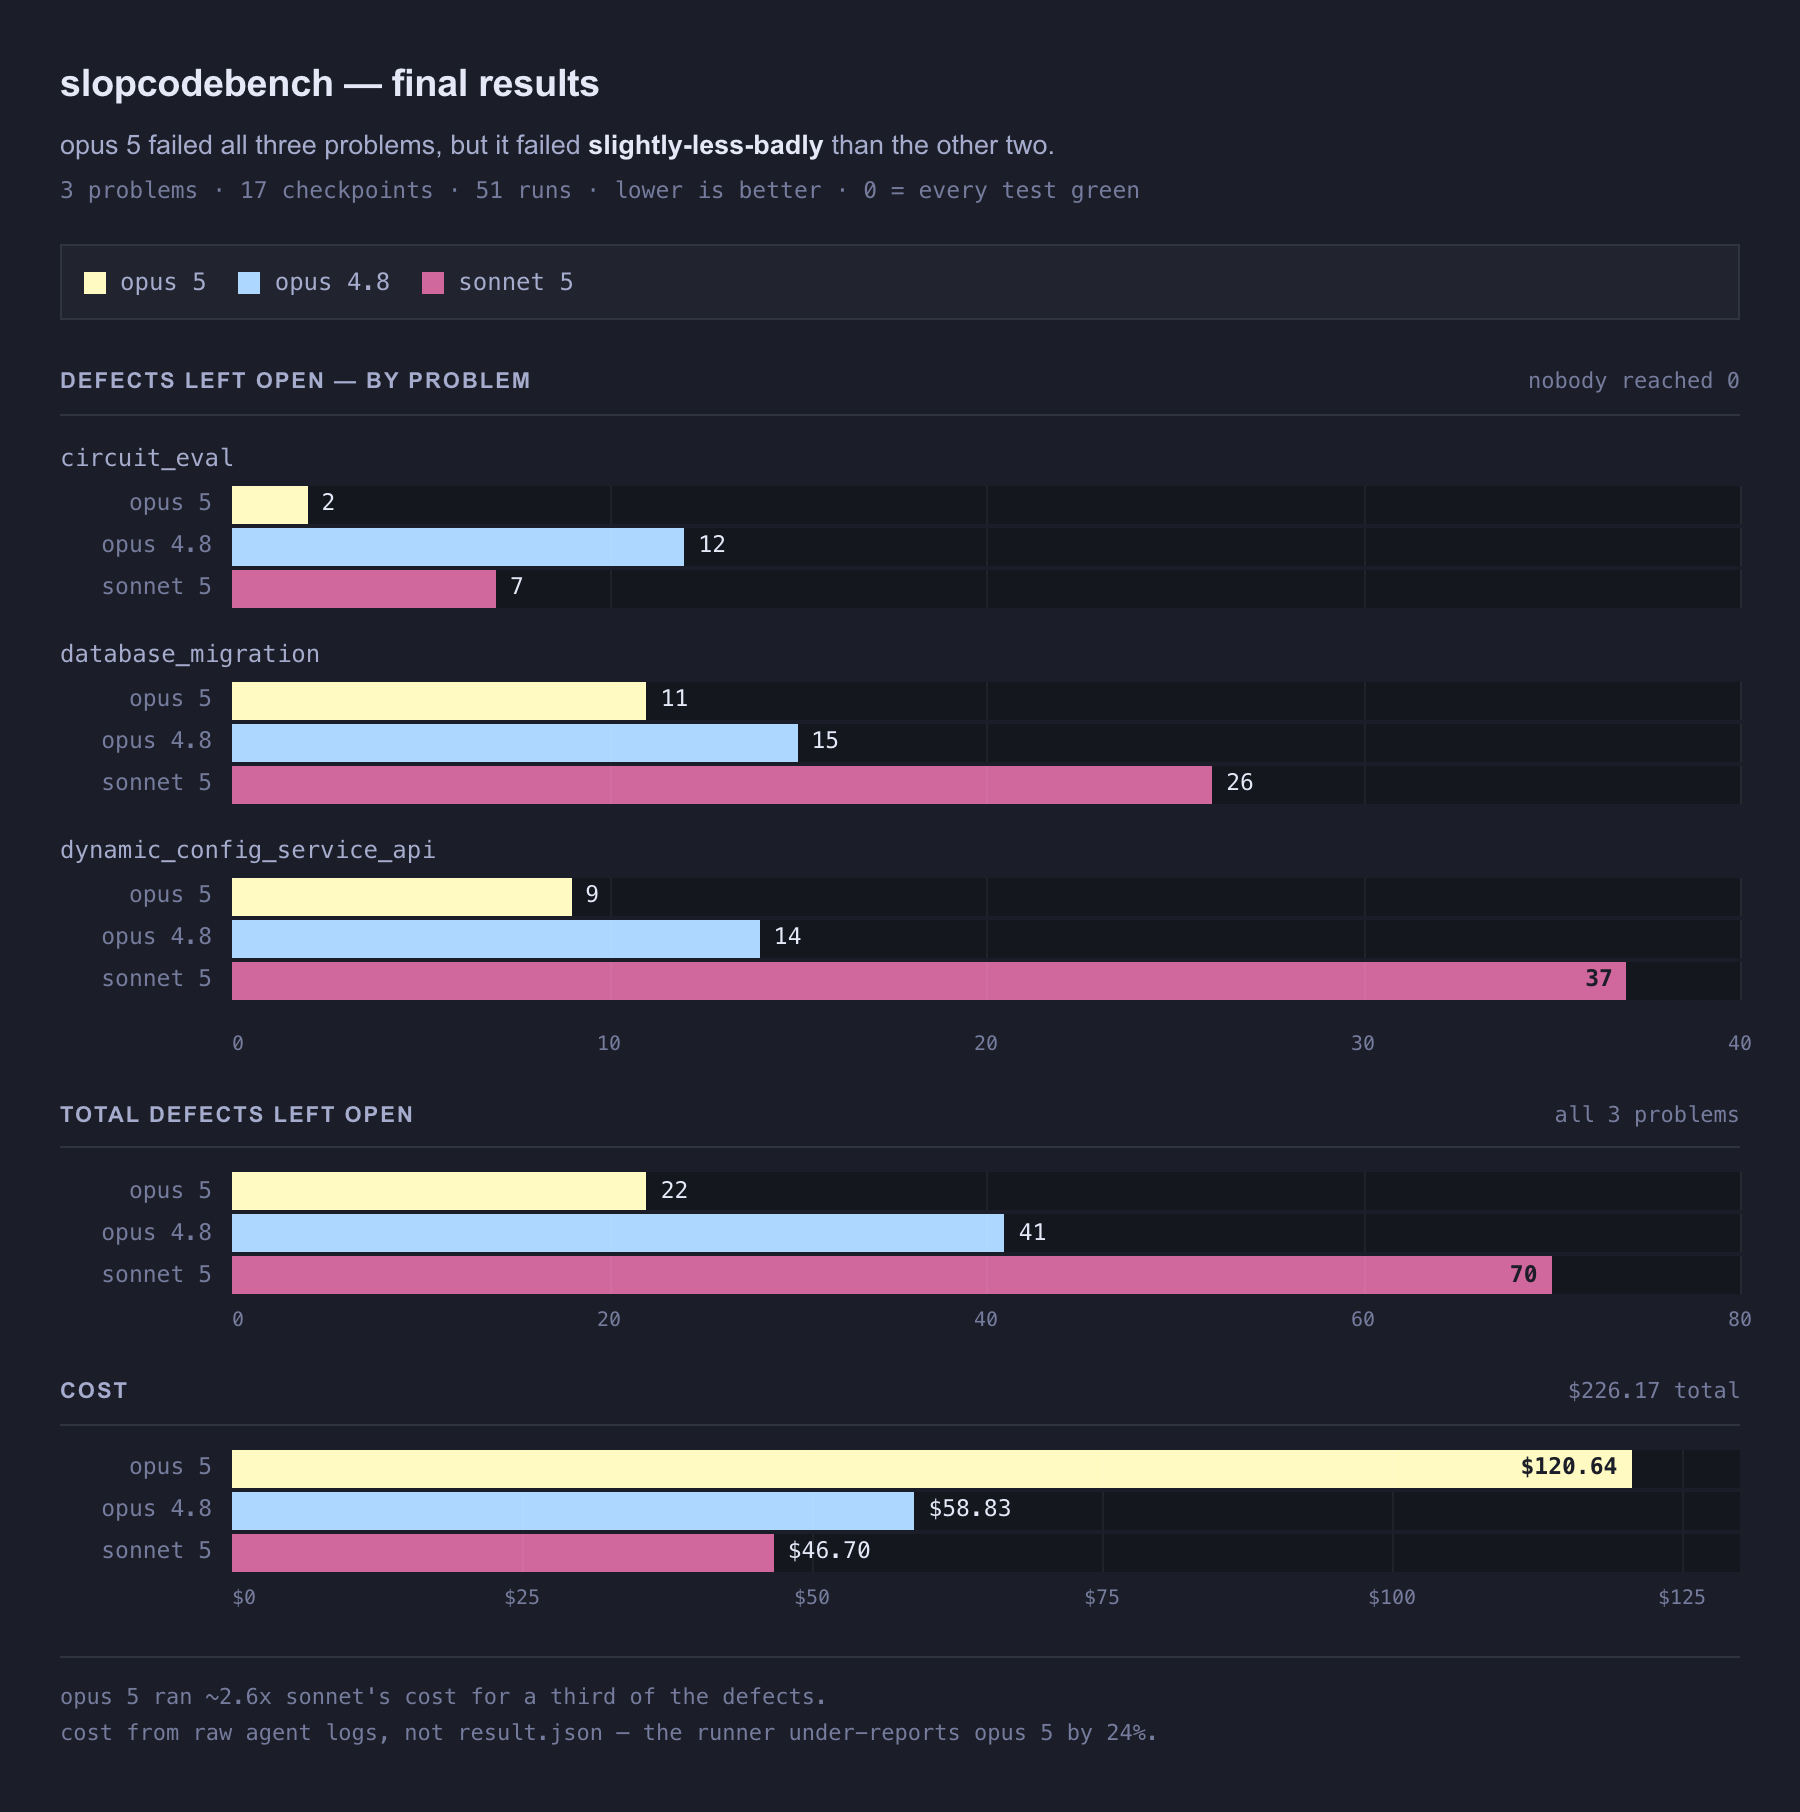
By the end of each problem, every model had left defects open. Opus 5 ended with the fewest unresolved issues on the easy problem but still failed the final checkpoint. On the hard dynamic_config_service_api problem, all three models cratered.
The Slop Meter: More Code, More Problems
SlopCodeBench tracks 41 code quality metrics across each checkpoint. Size, complexity, duplication, decomposition, rule violations, dependency graph. The results confirm what many have suspected from experience but couldn’t prove with data: codebase quality degrades over time for every model.
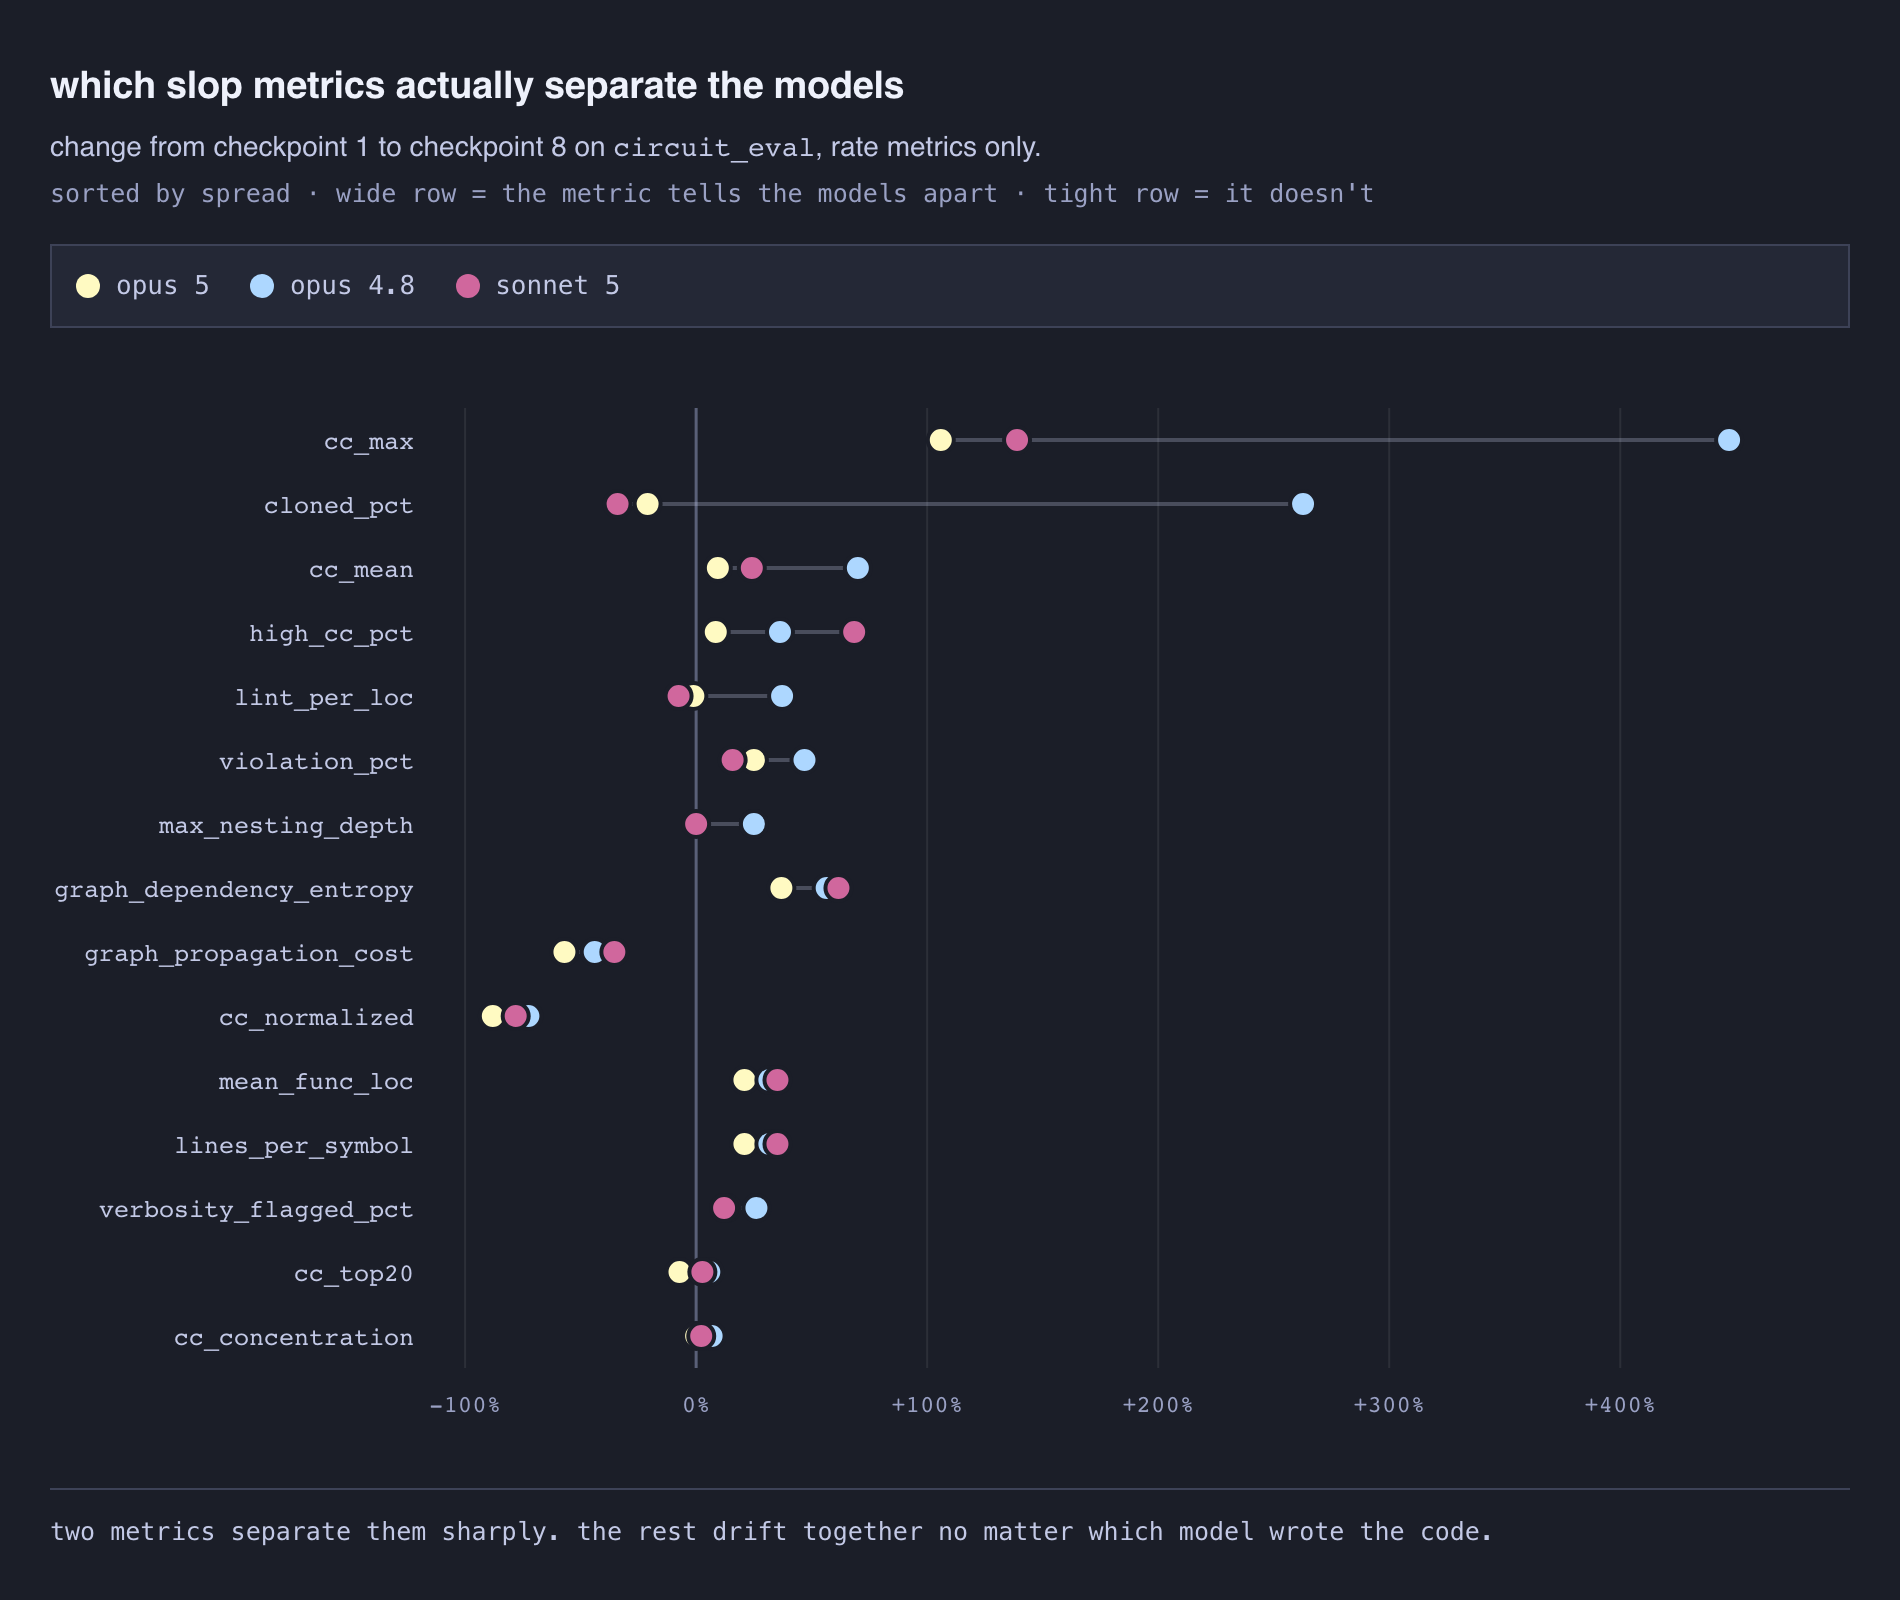
The percent change from checkpoint 1 to checkpoint 8 for various metrics tells a stark story. Most metrics cluster tightly across models, they all degrade roughly the same way. But two metrics sharply separate the models: maximum cyclomatic complexity and cloned code percentage.
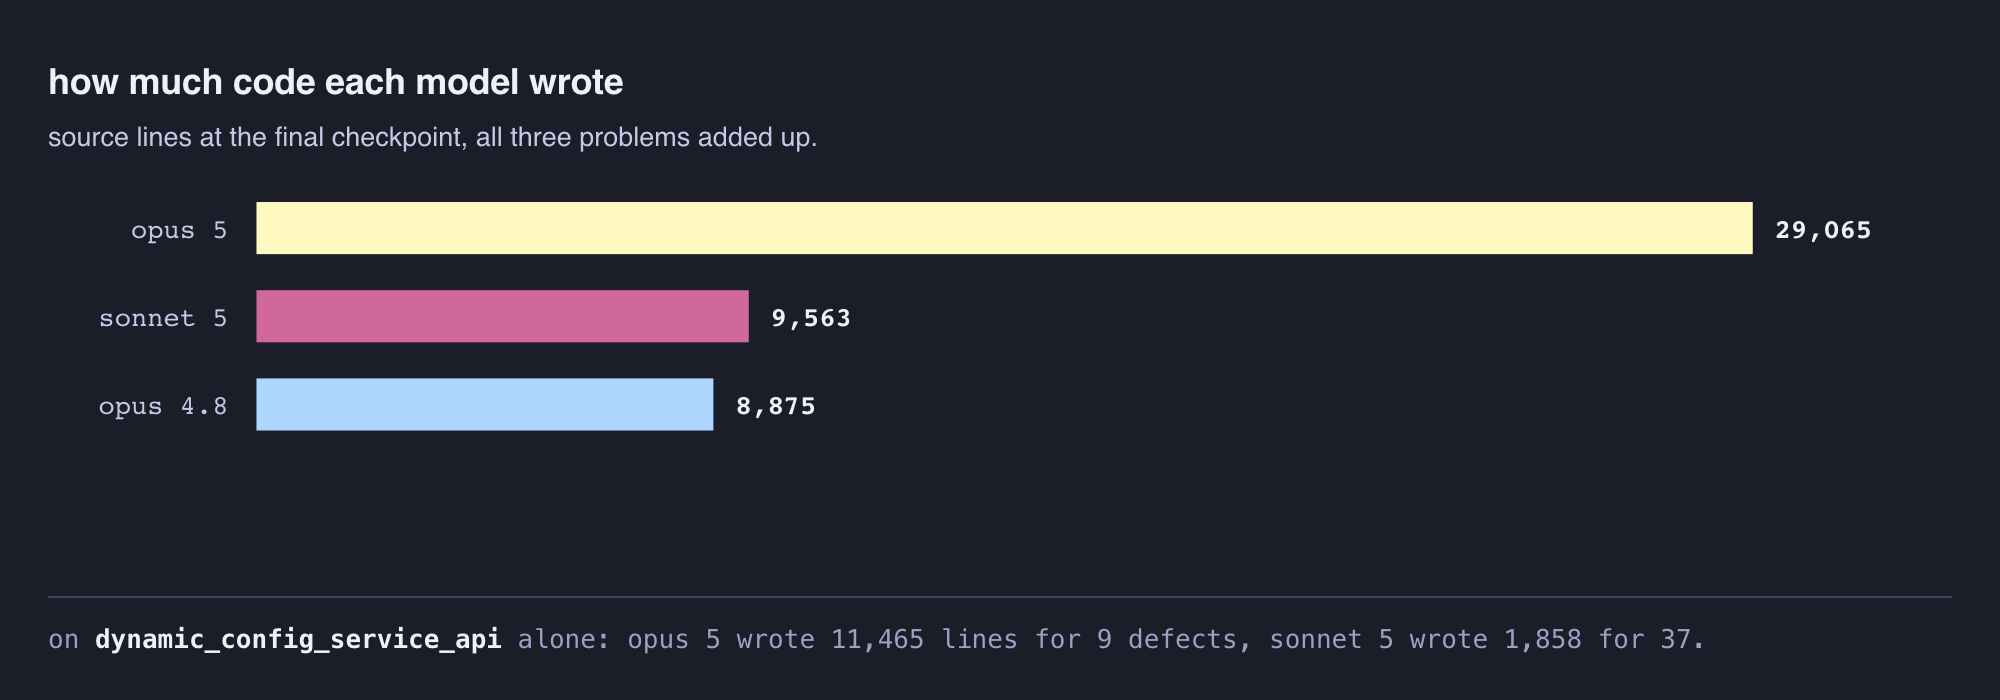
Opus 5 wrote an astonishing 29,065 lines of source code across the three problems, roughly three times what Opus 4.8 and Sonnet 5 each produced. But 51% of that was test code. The production volume was closer to 1.8x Opus 4.8. The question is whether that extra verbosity bought anything meaningful.
The Function Factory
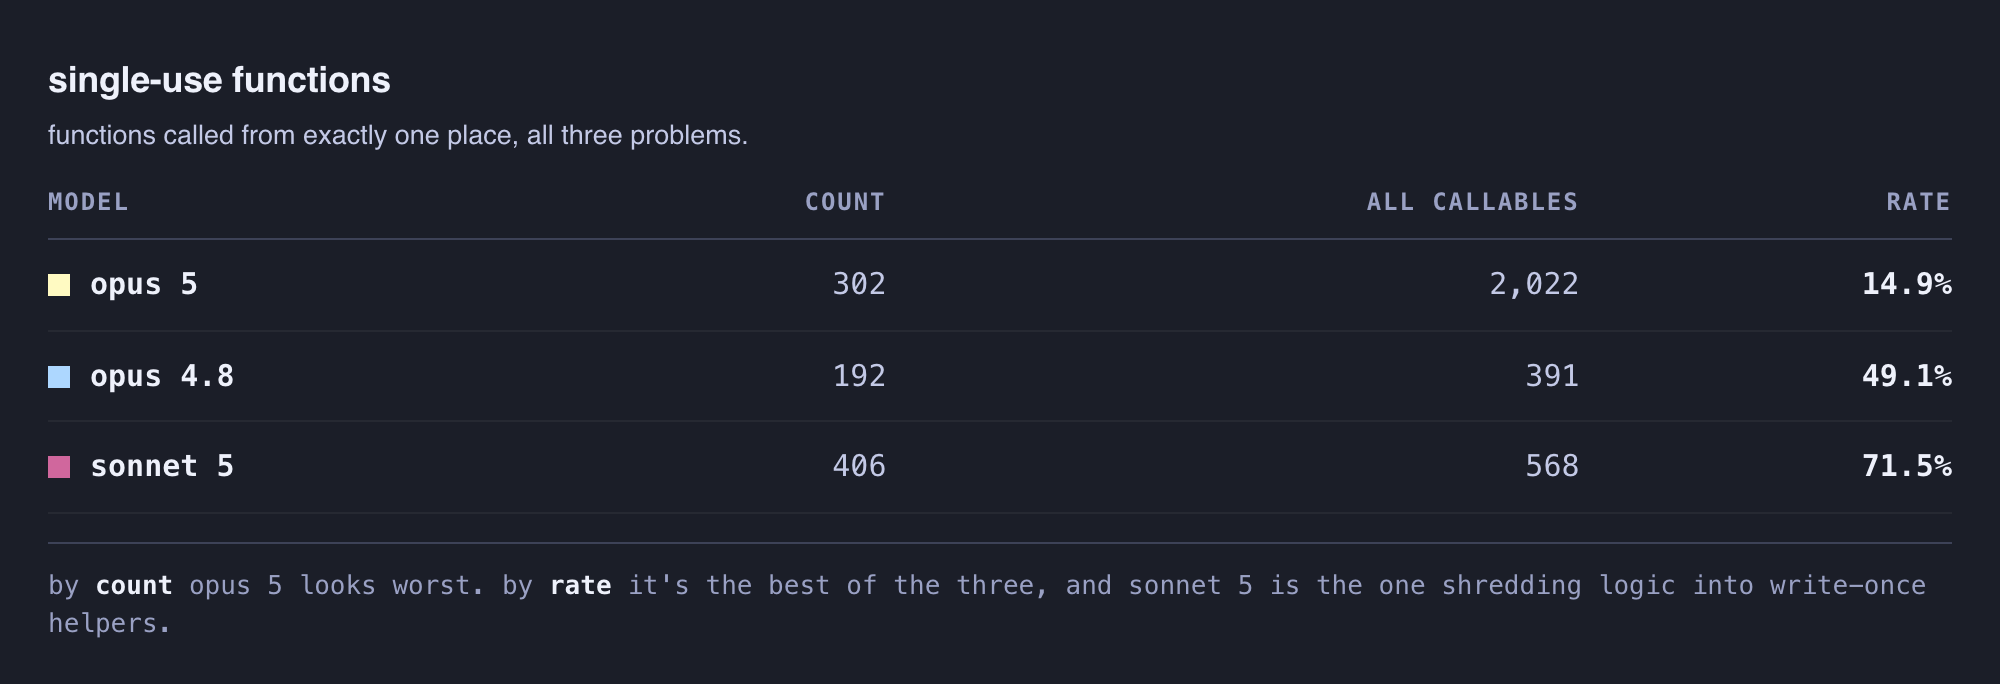
Opus 5 wrote five times more functions than the other two models. But here’s the twist: only 14.9% of Opus 5’s functions were single-use, called exactly once. Opus 4.8 hit 49.1%. Sonnet 5 hit 71.5%. The newer model is writing more functions but organizing them better.
This echoes the ongoing debate about model size and architectural design choices. The Qwen 3.5 efficiency breakthroughs show that small, well-structured models can outperform bloated ones. Opus 5 seems to be discovering a similar lesson internally, lots of small, reusable functions beat fewer monolithic ones, but it’s paying the cost in sheer token volume.
Complexity Creep Is Universal
Not a single model made it through all challenges without increasing cyclomatic complexity across checkpoints. Opus 5 has the lowest mean complexity but also wrote 2,000 functions. Sonnet and Opus 4.8 answered increasing checkpoint complexity by making individual functions bigger rather than refactoring.
Opus 4.8 was the worst offender, its mean cyclomatic complexity jumped 70% over eight checkpoints, and its single worst function ended at a cyclomatic complexity of 93. For reference, most style guides recommend refactoring anything above 10. Duplication for Opus 4.8 went from 4.6% to 16.8%, with the inflection point at checkpoint 3, roughly where new requirements start fighting the initial design.
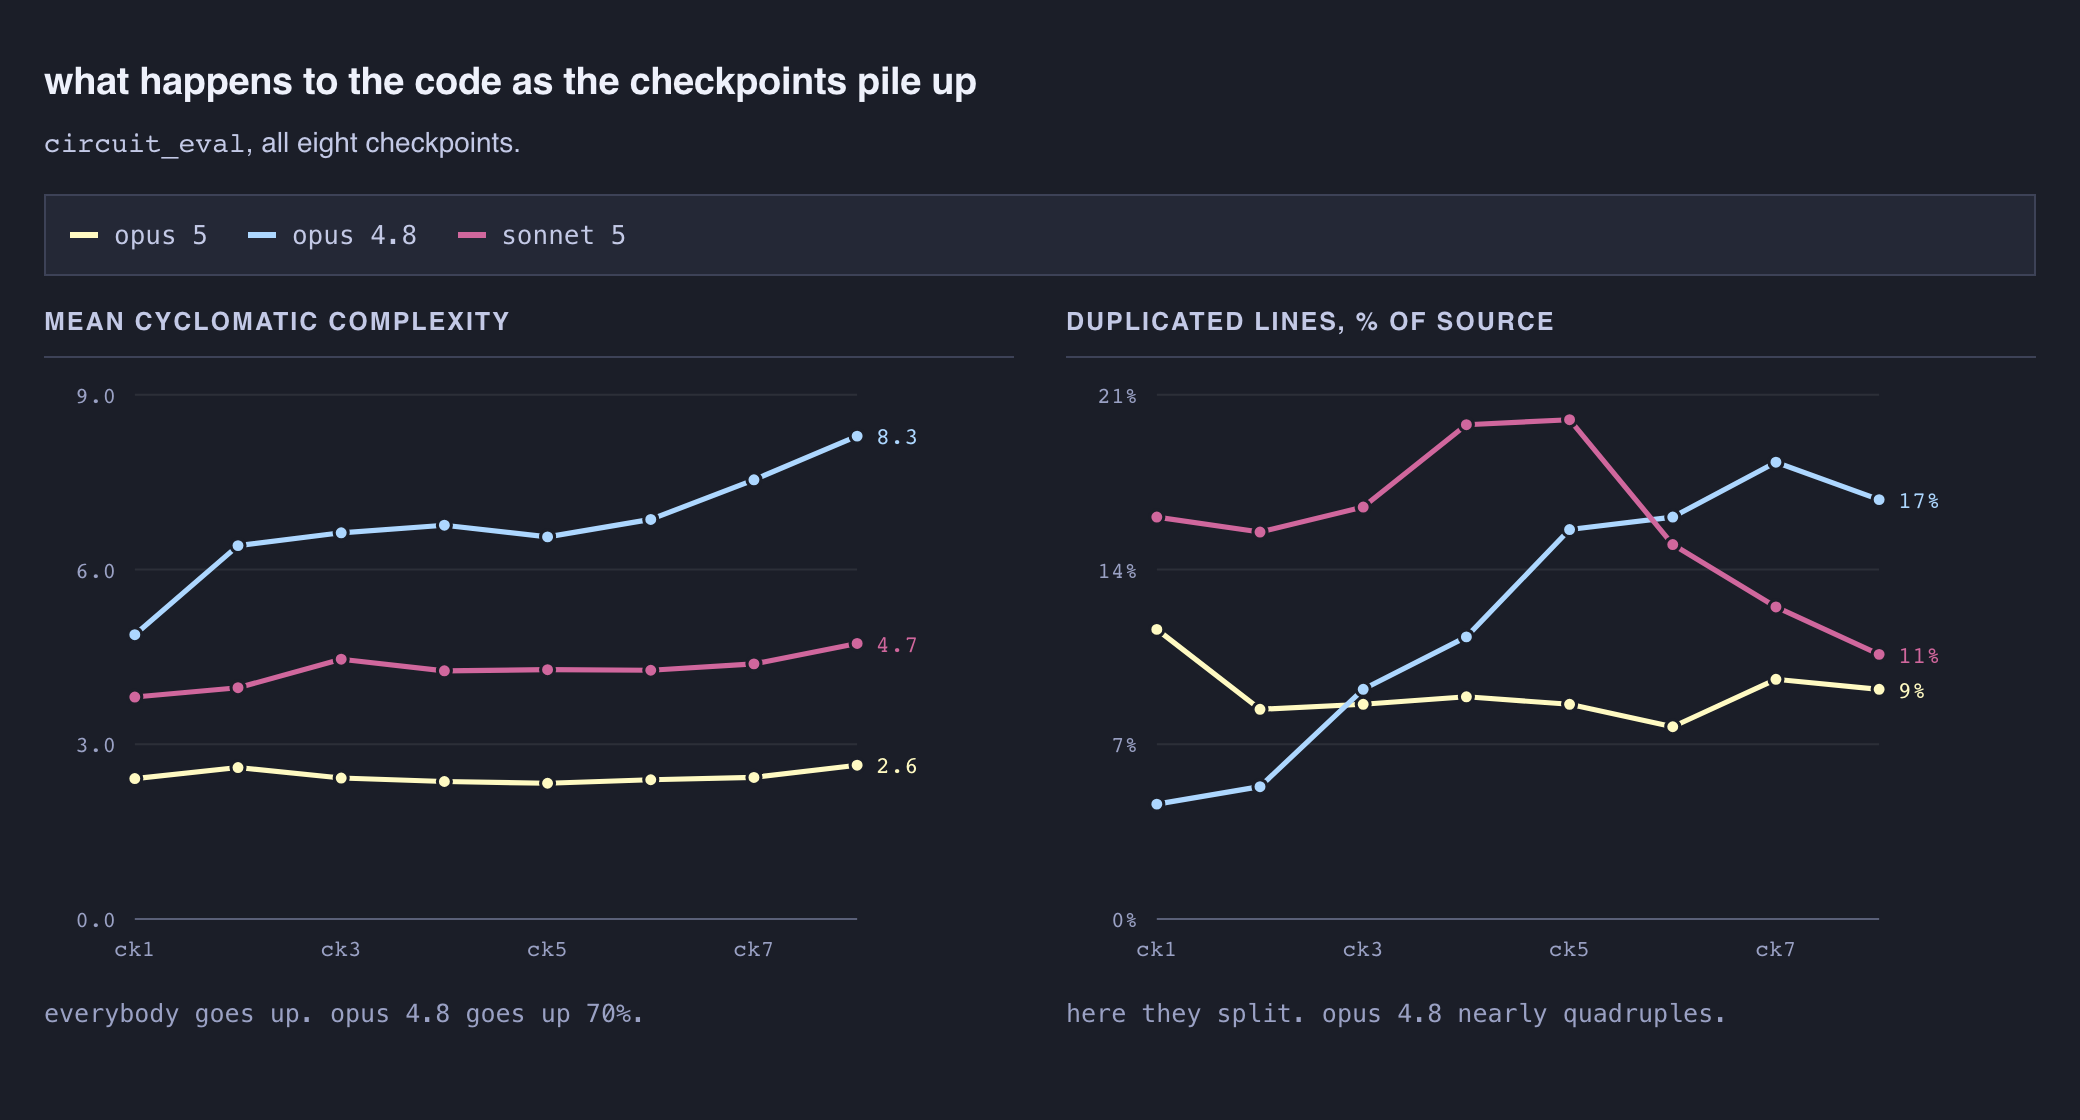
Opus 5 was basically flat on duplication (2.41% to 2.64%), a genuine improvement over previous generations. But this is where the “vibes-based” arguments about benchmarking open models on agentic coding tasks start to intersect with hard data.
The Cost of Correctness
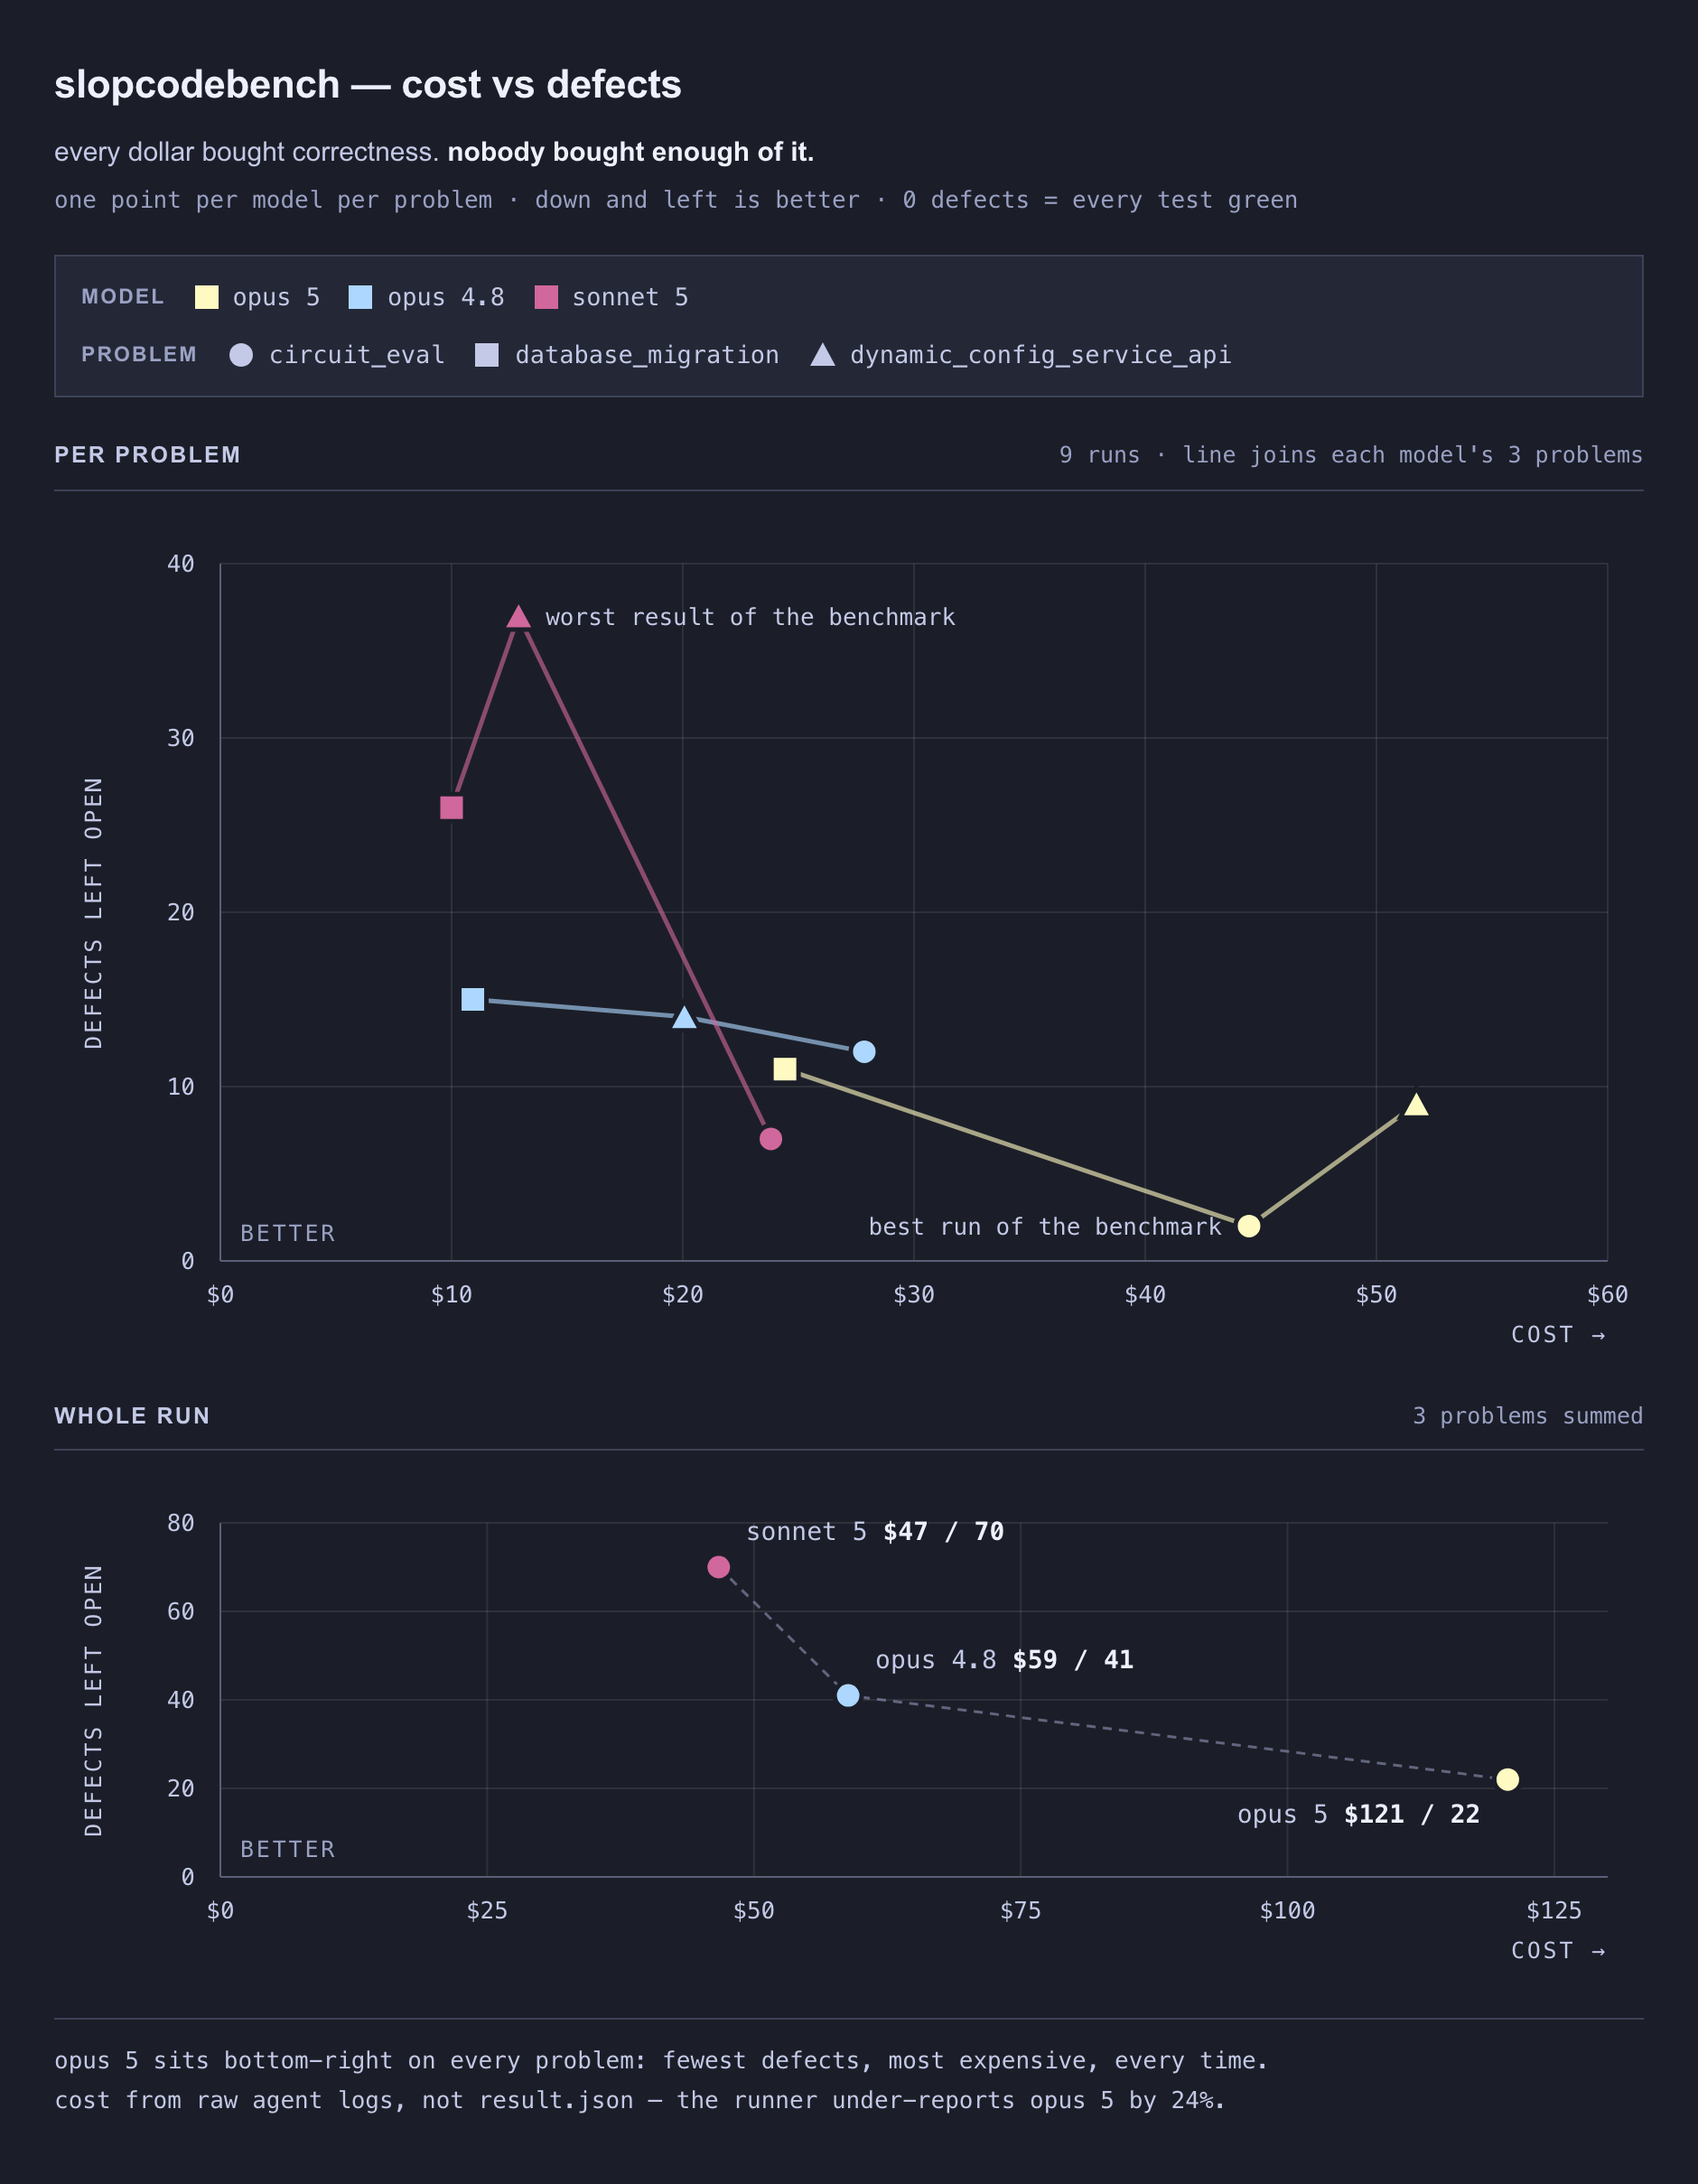
The relationship between cost and defects is telling: every dollar bought some correctness, but nobody bought enough of it.
This has direct implications for anyone building agent-based coding systems. If you’re wiring up a multi-agent pipeline, whether through Claude Code, Codex, or open-weight models entering mainstream platforms, you need to account for this architectural feedback loop. The model that writes the cleanest checkpoint 1 may set you up for the worst failure at checkpoint 5.
Better Oracles for Software Quality
The current SlopCodeBench metrics are useful but not definitive. Almost all the code triggered at least one “slop” rule: 98% for Opus 4.8, 93% for Opus 5, 89% for Sonnet 5. Lines flagged as verbose went from 65% at checkpoint 1 to roughly 80% by checkpoint 8 for every model. Some of these rules are probably over-aggressive, the benchmark’s Python detectors flagged lines in a TypeScript monorepo at a rate 11.6x higher than human-reviewed code.
But there’s a smarter evaluation on the horizon. The idea is simple: have a frontier model build checkpoints 1 through N, then hand the codebase to a weaker model for checkpoint N+1. If the weaker model can implement the next change without breaking things, the frontier model built maintainable code. If the weaker model fails, the frontier model’s code was slop.
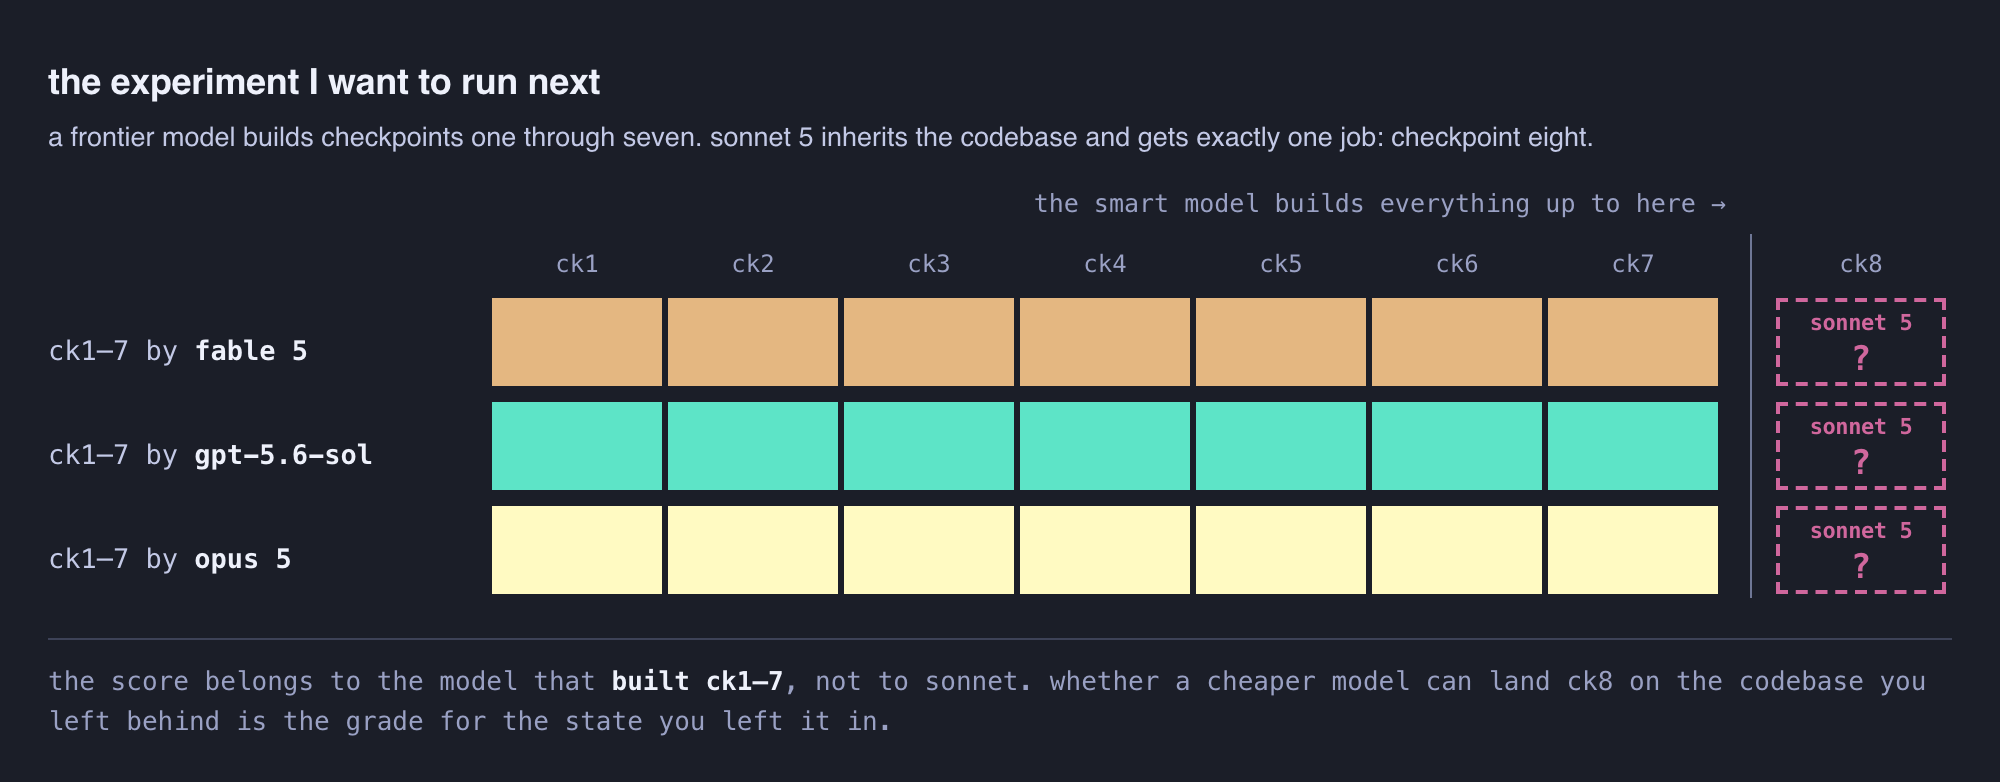
This “handoff” metric amplifies the signal of whether the smart model’s code is actually maintainable. A model like Sonnet or Terra implementing checkpoint 8 provides a much more honest evaluation than any static analysis metric.
What This Means for Architecture
The SlopCodeBench results confirm a pattern that Qwen 3.7’s benchmark dominance hinted at: raw benchmark performance on static problems doesn’t predict iterative codebase maintenance. The models that score highest on HumanEval or LiveCodeBench aren’t necessarily the models you want evolving your production codebase over weeks and months.
For architects designing agent-based development pipelines, the lesson is brutally practical:
- Plan for degradation. Every model will introduce complexity over successive changes. Build guardrails, automated complexity checks, test coverage floors, code review gates, into your pipeline.
- Test the handoff. If you’re using a pipeline with different models for different stages, verify that the handoff between models doesn’t lose context. The “handoff metric” isn’t just a benchmark concept, it’s a production concern.
- Measure the right thing. Strict pass rate across incremental checkpoints is a much better signal for production readiness than any single-shot benchmark. If your workflow involves iterating on existing code, benchmark that iteration explicitly.
- The models still can’t run lights-off. This is the big one. Even Opus 5, with its 24% pass rate and massive code output, failed every multi-checkpoint problem. As one observer put it: “Today’s models can’t be relied on to run lights-off without steering.”
The Qwen 3.5 small series teaches us that efficiency matters as much as capability. The Qwen 3.7 series shows that benchmark dominance can be fleeting. But the SlopCodeBench results cut through the noise: we don’t have models that can maintain a codebase over time, and we need better benchmarks to know when we do.
The frontier is still dumb. It’s just slightly less dumb than it was three months ago.