
Beyond CPU and RAM: The Metrics That Reveal Your Architecture Is Dying
Your monitoring dashboard looks like a Christmas tree of green. CPU hovers at a comfortable 40%, RAM usage sits at 60%, and those generic HTTP 200 counts keep climbing. Meanwhile, your biggest customer just discovered they’ve been underbilled by $400,000 over eighteen months. No alerts fired. The system worked exactly as designed. This is the architectural health mirage, and it’s costing you more than downtime ever could.
The problem isn’t that you’re not monitoring enough, it’s that you’re measuring the wrong things. When an architect on Reddit asked what metrics actually reveal platform stability, the community’s answer was unanimous: stop obsessing over infrastructure vitals and start tracking what matters to users and the business. But that transition is where most teams crash and burn.
The CPU and RAM Illusion
Traditional monitoring was built for a world where a server was a server. CPU, memory, disk I/O, these were reasonable proxies for system health when your application lived on a single machine. In distributed systems, they’re about as useful as checking your car’s tire pressure to diagnose a failing transmission.
Your Kubernetes pods can be perfectly “healthy” while end users experience 99th percentile latency that makes your application unusable. As one observability engineer put it, metrics-only tools fail when causality spans services, nodes, and networks. The real killers aren’t resource exhaustion, they’re circuit breaker storms, cascading retry loops, and the silent data corruption that happens when your message queue backpressures just enough to be annoying but not enough to trigger alerts.
This is where the shift from monitoring to observability becomes non-negotiable. Monitoring tells you that something failed. Observability, as UptimeRobot’s guide explains, explains why issues occur, not just detecting them. It’s the difference between knowing your API is slow and understanding that a single downstream service’s connection pool exhaustion is causing thread contention that ripples across 47 microservices.
The Telemetry Signals You’re Probably Ignoring
The observability community loves talking about “the three pillars”, logs, metrics, and traces. But the real magic happens in the signals most teams treat as afterthoughts. Let’s look at what actually moves the needle during an architecture audit.
Custom Application-Level Metrics
The OVHcloud team deploying LLMs on their infrastructure discovered something profound: autoscaling based on CPU/RAM is useless for inference workloads. Instead, they track vllm:num_requests_running to scale GPU-backed replicas based on actual inference load. When the average number of in-flight requests exceeds 50, the system adds capacity. Not because a server is “busy”, but because the application layer is saturating.
This is the pattern that separates surviving architectures from thriving ones. Your business logic exposes signals that infrastructure metrics will never capture:
- Queue depth with business context: Not just “how many messages”, but “how many orders over $10K are stuck in payment processing”
- Saga pattern completion rates: Tracking distributed transaction success rates, not just individual service health
- Feature flag performance variance: Measuring how new code paths impact the same infrastructure
High Cardinality: The Edge Case Goldmine
Traditional monitoring aggregates away the very data that reveals architectural cracks. High cardinality telemetry, capturing individual user IDs, session IDs, or transaction patterns, surfaces problems that vanish in averages.
Imagine tracking checkout_failure_rate aggregated across all users. It’s stable at 0.1%. But drill down to checkout_failure_rate{user_segment="enterprise"} and you discover a 15% failure rate for your most valuable customers. The infrastructure metrics look pristine. The business is hemorrhaging revenue.
This is why tools like Prometheus struggle with cardinality out of the box, and why modern observability platforms invest heavily in handling it. The cost is higher, but the alternative is flying blind on the problems that actually matter.
Configuration Drift as a Leading Indicator
Here’s a metric nobody tracks: time since last config audit. In the Reddit discussion about architecture health, one commenter pointed out that servers can be perfectly “healthy” while configuration drift slowly poisons your system.
Your application code goes through rigorous CI/CD, but your feature flags, database indexes, and API gateway rules change manually, with zero visibility. This is where runtime configuration as a critical architectural health metric becomes essential. Track not just what your config is, but how it changes and who changes it.
Datadog’s 2026 research shows that 64% of organizations see fewer customer-impacting incidents when observability and security teams work together. Why? Because configuration changes are often the smoking gun in both performance issues and security breaches.
The Implementation Trap: Why More Data Isn’t Better
The UptimeRobot guide warns bluntly: collecting too much telemetry can be overwhelming. Without clear goals, it’s easy to get lost in a sea of logs, metrics, and traces. This is where architecture audits go to die.
The Tool Sprawl Tax
Most open-source observability setups combine Prometheus for metrics, ELK/OpenSearch for logs, and Jaeger for tracing. Each tool is excellent at its job, but correlation becomes your full-time job. You spend more time context-switching between dashboards than fixing problems.
Groundcover’s analysis is brutal: open source UIs are not as user-friendly as those that you’ll find from well-designed vendor solutions. Open source developers mostly work for free and do not have the design and usability testing budgets of software companies. The hidden cost isn’t licensing, it’s the engineering hours spent duct-taping tools together while your architecture rots.
Alert Fatigue Is a Metric
Here’s a meta-metric that predicts architectural health: signal-to-noise ratio in your alerting system. If your on-call team receives 500 alerts per week but only 3 require action, you’ve built a system that trains people to ignore signals.
The fix isn’t better alert thresholds, it’s correlated signals. When a deployment event coincides with a spike in checkout failures and a drop in database connection pool availability, you have a story. When you get three separate alerts, you have noise.
A Framework for Measuring What Matters
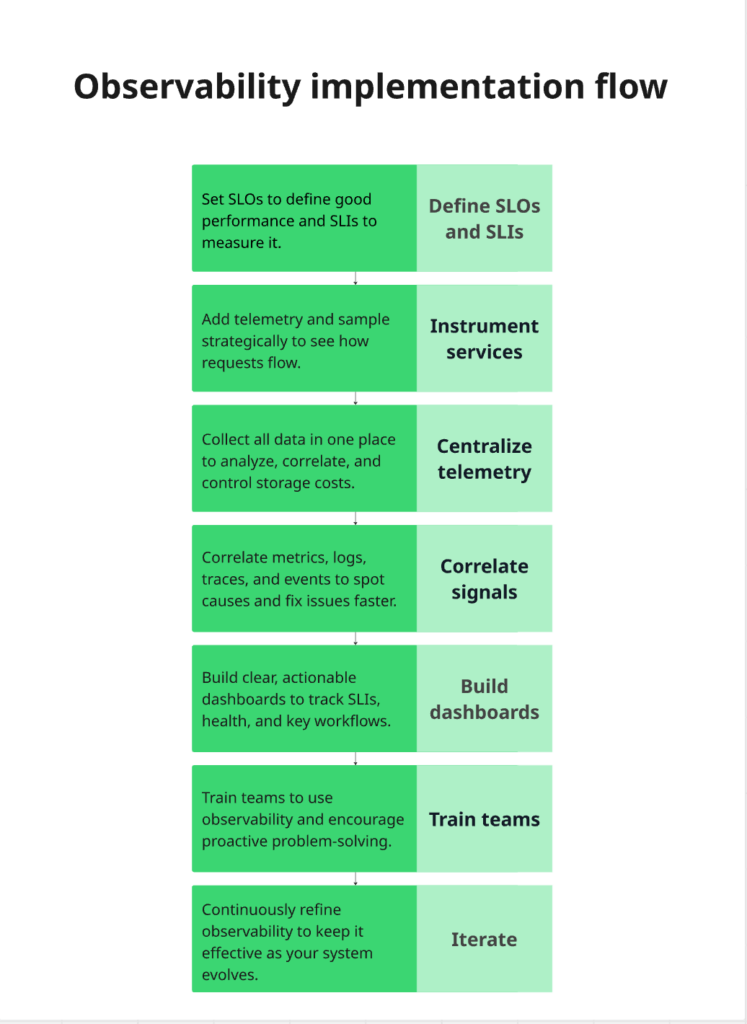
Based on the OVHcloud reference architecture and UptimeRobot’s implementation guide, here’s a practical approach to auditing architectural health:
1. Define SLOs That Map to Business Pain
Forget 99.9% uptime. What does “available” mean for your users? For an e-commerce platform, it’s not API responses, it’s successful checkout completion. For an LLM service, it’s time-to-first-token under 500ms for 95% of requests.
The OVHcloud team tracks vllm:time_to_first_token_seconds directly because it correlates with user experience. Your SLOs should be business metrics that happen to be measurable with technical tools.
2. Instrument for Causality, Not Collection
The Groundcover team emphasizes: the best observability tools reduce the gap between raw telemetry and an actionable decision. Every metric you collect should answer a specific “why” question:
- Why did this request fail? → Trace + logs
- Why is latency spiking? → Metrics with high cardinality breakdowns
- Why did this deployment cause issues? → Events correlated with performance shifts
3. Build Dashboards for Exploration, Not Decoration
Static dashboards showing CPU graphs are digital wallpaper. Dynamic exploration interfaces let you start with a symptom (“checkout failures up”) and iteratively drill down to the cause (“payment service’s Redis cluster in us-east-1a is experiencing 50% packet loss”).
This requires semantic context, every signal enriched with service name, region, version, and user segment. Without it, you’re just searching through logs like it’s 2009.
4. Track Team Coordination as a System Metric
This is the most controversial insight: architectural health correlates with team interaction patterns. The Reddit discussion hinted at this when asking for metrics that reveal if architecture is “sound or burning down.”
When team coordination and system edge cases in architectural failures occur, you see patterns:
– Deployment frequency drops while hotfix rate increases
– Cross-team incidents take 3x longer to resolve
– The same components appear in every post-mortem
These aren’t technical metrics, but they predict technical debt better than any code coverage report.
The AI-Native Future of Architectural Audits
Datadog’s 2026 research report reveals where this is heading: AI-driven anomaly detection that monitors AI. As organizations deploy more complex LLM-based applications, the “stack” becomes harder to manage. Observability platforms are becoming the “intelligence layer” that prevents catastrophic downtime.
The OVHcloud architecture demonstrates this future today. Their autoscaling doesn’t just react to CPU, it predicts inference load based on request patterns. Their monitoring doesn’t just alert, it correlates vLLM metrics (vllm:kv_cache_usage_perc, vllm:num_preemptions_total) with GPU utilization to forecast capacity bottlenecks.
This is the new baseline: observability that explains system behavior without human intervention. But it only works if you’ve instrumented the right signals. AI can’t correlate data you didn’t collect.
Your Architecture Audit Checklist
If you’re auditing a system from scratch and can only pick a handful of metrics, here’s the “Must-Have” list that actually reveals architectural health:
- Business Journey Completion Rate: Not “API success rate”, but “percentage of users who successfully completed the core value proposition”
- Configuration Change Velocity & Variance: How often config changes, how many manual vs. automated changes, drift between environments
- High Cardinality Failure Patterns: Top 10 failure modes broken down by user segment, feature flag, and deployment version
- Cross-Service Contention Index: How often services block each other, measured through distributed traces
- Team Incident Overlap: Which components appear in incidents across multiple teams (signals architectural coupling)
- Time-to-Detect vs. Time-to-Resolve: The gap between “system started failing” and “we noticed” reveals observability maturity
Notice what’s missing: CPU, RAM, disk space. Those are symptoms, not causes. They’re the fever, not the infection.
The Bottom Line
The most insightful comment from the Reddit discussion was deceptively simple: make sure you choose some metrics that are meaningful to the business and the end user. No point in fretting about requests per second if it has no impact on value creation.
Your architecture isn’t healthy because your servers are humming. It’s healthy when users get value, teams can deploy confidently, and you sleep through on-call rotations. The metrics that matter reflect those outcomes, not the infrastructure that enables them.
The next time you’re greenlit to redesign your observability strategy, validate your system design without traditional oversight by asking one question: If this metric spiked at 3 AM, would I know what to do? If the answer is no, you’re not measuring architectural health. You’re collecting trivia.
Start measuring what kills you, not what fills dashboards. Your future self, and your architecture, will thank you.

Ready to dive deeper? Explore how database consistency and architectural simplification at scale impacts your metric strategy, or learn why runtime configuration as a critical architectural health metric might be your biggest blind spot.