It starts innocently enough, a simple INSERT INTO audit_logs here, a compliance checkbox there. But that audit logs table in your primary Postgres cluster is quietly setting up shop as a silent assassin, waiting to destabilize your entire application infrastructure when you least expect it.
This architectural anti-pattern remains stubbornly common, especially in Series A/B startups racing to build features without considering operational consequences. What begins as a convenient append-only table ends up consuming your database’s CPU, choking I/O, and turning recovery from minutes into hours.
The Vacuum Death Spiral: When Your Logs Consume Your Database
The problem isn’t just that audit logs generate write-heavy workloads, it’s how they interact with PostgreSQL’s MVCC (Multi-Version Concurrency Control) architecture. Every audit log entry creates “dead tuples” that vacuum must eventually clean up.
But as the audit_logs table grows to hundreds of millions of rows, autovacuum struggles to keep pace. Even in append-only tables, background tasks and index updates create dead tuples that vacuum must process. When developers report primary databases locking up not because of bad user queries, but because autovacuum was choking on the audit table, you’ve entered the vacuum death spiral.

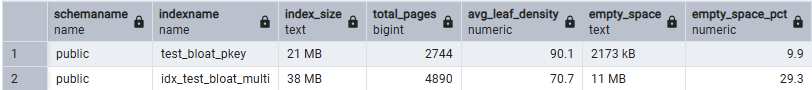
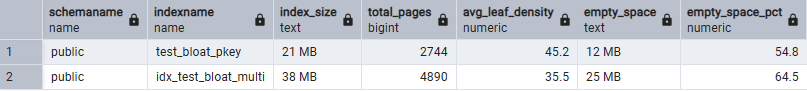
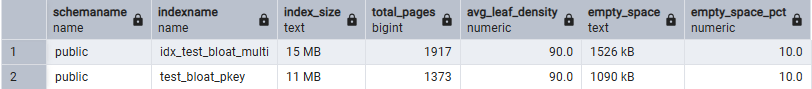
The cascade effect is brutal: as vacuum falls behind, dead tuples accumulate, bloating both tables and indexes. Indexes can double in size with pages that should be 90% full dropping to 45% density or worse. Bloated indexes mean vacuum takes longer, which means it falls further behind, creating more bloat, a vicious cycle that ends with your database CPU dedicated to cleanup rather than serving users.
The Compliance Trap: PGAudit Isn’t What You Think
When SOC 2 or HIPAA compliance requirements land on engineering teams, PostgreSQL’s pgaudit extension often gets misapplied as the silver bullet. The extension was designed for infrastructure compliance, tracking whether a superuser dropped a table, not application-level audit trails like “did User X change the billing plan?”
The PGAudit documentation explicitly warns about performance risks: “if done in excess, it can noticeably reduce database performance.” Yet teams deploy it indiscriminately, logging to text files or stderr, creating massive noise overhead. Trying to build customer-facing Activity Log UI by grepping terabytes of raw logs in CloudWatch becomes an operational nightmare.
Recovery Time Objectives Turn from Minutes to Hours
Consider your current Recovery Time Objective (RTO). Now imagine your database crashes during peak traffic. Instead of restoring gigabytes of core data, you’re restoring terabytes of historical audit logs just to get the login screen back online. Recovery windows stretch from minutes to hours as you wait for years of audit history to stream back into place.
The irony is palpable: the very mechanism designed to ensure compliance and auditability becomes the single point of failure that makes recovery impossible within reasonable timeframes. Teams have experienced this firsthand, with primary database lockups occurring not from problematic user queries, but because autovacuum was choking on the audit table, stealing cycles from the actual application.
Index Bloat: The Silent Performance Tax
Audit logs create a double-whammy: table bloat from dead tuples and index bloat from constantly updating indexes on rapidly growing data. When indexes become severely bloated, vacuum has to scan through significantly more pages, consuming disproportionate CPU and I/O resources.
As research shows, the cascade effect can turn a 20ms query into a 3-second timeout mystery. You’ll see CPU and memory metrics looking normal while disk usage mysteriously rises and response times crater.
The bloat accumulates through normal operations: deletes make index entries dead tuples, updates (implemented as delete-plus-insert) create additional churn, and page splits in B-tree indexes compound the problem. The end result is an index that should be 10 GB ballooning to 15 GB or more, forcing vacuum to work through all that extra space.
The Scale Problem: 5 Audit Events Per User Action
The real danger emerges at scale. Consider that a single user action, like updating settings, often triggers 3-5 distinct audit events. Your audit table grows 5-10x faster than your core data tables. At millions of users, this becomes unsustainable.
One effective mitigation strategy involves partitioning, keeping only the latest 30 days available for immediate review while archiving older data to cold storage. However, as developers note, using DELETE to purge old data causes vacuum bloat, while auditors inevitably request three-month-old logs at the most inconvenient times.
Better Architectures: Evidence vs. Data Separation
The scalable alternative involves treating audit logs as evidence rather than data. Instead of mixing high-volume logging with transactional operations, the pattern that actually works involves:
- Transactional Data: Stays in Postgres (hot, mutable)
- Compliance Evidence: Async Queue → Merkle Hash (for immutability) → Cold Storage (S3/ClickHouse/TimescaleDB)
This separation keeps your primary shared_buffers clean for the data users actually query 99% of the time. Many teams implement this by dropping messages containing audit info onto a broker, then having separate applications process those messages to write to an isolated database.
TimescaleDB emerges as particularly effective here, dropping chunks instead of rows avoids the vacuum death spiral entirely. The key insight is that audit data has different access patterns: write-heavy, rarely updated, and typically accessed in chronological order.
The Atomicity Trade-Off: Banking vs. SaaS Reality
This architectural shift introduces complexity around atomicity. As one developer noted, “fire-and-forget is not atomic. If your server pulls the plug exactly after the DB commit but before the network call, you lose that log.”
For true atomicity, you need the Transactional Outbox Pattern: writing the event to a local table in the same transaction as your business logic, then having a separate worker push it out. But as one banking-focused developer pointed out, this adds massive operational complexity.
The reality for most SaaS applications? Trading strict atomicity for zero latency on the main thread with retry mechanisms for network blips provides acceptable durability without the complexity tax.
Practical Migration Strategy: Starting Small
Transitioning away from embedded audit logging doesn’t require a full rewrite. Start simple: application drops audit messages onto a message broker. A separate service processes these messages and writes to an isolated database cluster dedicated to audit data.
For immediate relief while planning the migration, implement table partitioning and aggressive retention policies. Use REINDEX CONCURRENTLY to combat existing bloat without downtime. But recognize these as temporary fixes, the fundamental architectural problem requires separating evidence from data.
The most critical step is recognizing that audit logs aren’t just another table, they’re a fundamentally different workload with distinct characteristics that demand specialized infrastructure. Treating them as first-class architectural citizens rather than database appendices prevents the slow-motion performance collapse that derails scaling applications.