
You know what’s worse than no architecture diagram? An outdated one that confidently shows a system topology that hasn’t existed for eighteen months. That diagram isn’t documentation, it’s architectural gaslighting. New engineers onboard, stare at that beautiful DrawIO masterpiece, and build mental models around infrastructure that’s already been decommissioned.
The manual diagram maintenance treadmill is eating teams alive. But there’s a better path: extracting architecture directly from the code itself, automating the boring parts, and letting your diagrams live as versioned artifacts that can’t drift out of sync.
The Diagram Debt Crisis Nobody’s Talking About
Most teams don’t lose their architecture in a dramatic collapse. They lose it through a thousand tiny merges, a service split here, a new queue added there. Six months later, your “current state” architecture doc is a historical artifact of decisions that were already reversed twice.
This is diagram debt, and it compounds silently. Every sprint that ships code without updating the architecture documentation adds interest to a debt that eventually demands payment in onboarding confusion, duplicated services, and architecture reviews that run on vibes instead of facts.
The C4 model has emerged as the de facto standard for describing software architecture because it works at different levels of abstraction. But the real question isn’t which notation you use, it’s how you keep it honest. And the answer, increasingly, is that your diagrams should be generated from the same source of truth your code comes from: your repository.
C4 as Infrastructure: Structured Data, Not Pretty Pictures
The common thread across every serious approach to automated diagrams is treating architectural information as structured data that lives alongside your code. The shift toward code-integrated architectural documentation isn’t just about tooling, it’s about changing where architectural truth lives.
For the format side, Structurizr has become the go-to answer. It lets you define your entire architecture as code, systems, containers, components, and the relationships between them, in a DSL that’s designed to be version-controlled, diffed, and reviewed like any other code. The tool then generates diagrams at multiple C4 levels from the same definition, including Mermaid exports if that’s your rendering preference.
The pattern that working teams converge on is refreshingly simple: commit Structurizr DSL files to the repository, then run a CI step that regenerates the images on every merge. Your diagrams literally cannot go stale because they’re rebuilt from source on every change, they’re as current as your main branch.
For Go and Python shops, libraries like PyStructurizr and go-structurizr exist specifically to generate those C4 inputs programmatically. If you’re working in a Go codebase, you can extract much of the container and component information directly from your code structure rather than manually transcribing it into a DSL.
What About the “Lighter” Approaches?
Not every team wants the ceremony of a full C4 implementation. The arc42 template offers a documentation-first alternative, though it’s focused more on capturing architectural decisions than driving diagram generation. The trade-off is straightforward: more ceremony buys you more automation, but you need to pick the level of process your team can sustain.
The Python Path: Diagram-as-Code with the Diagrams Library
If you’re not ready to commit to a full C4 workflow, the Python Diagrams library offers a pragmatic middle ground. It’s not full automation, you’re still describing the architecture rather than extracting it, but it gives you a versionable, code-based representation that can be regenerated automatically in CI/CD pipelines.
The library’s model is built around what it calls nodes: components that represent resources in your architecture. The import path tells you everything about the node type:
diagrams
└── aws
    └── compute
        └── EC2
A basic diagram with two connected nodes is deceptively simple:
from diagrams import Diagram
from diagrams.aws.compute import EC2
from diagrams.aws.database import RDS
from diagrams.aws.network import ELB

with Diagram("The three directions"):
    load_balancer = ELB("load-balancer")
    web_server = EC2("web-server")
    database = RDS("database")
    backup_server = EC2("backup-server")

    load_balancer >> web_server
    web_server << database
    database - backup_server
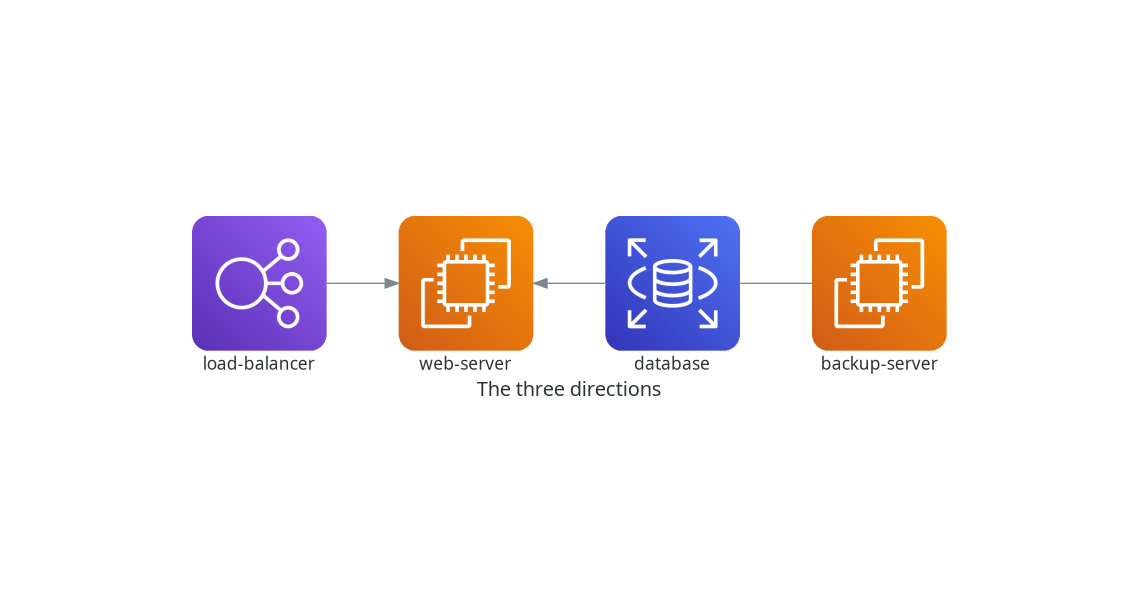
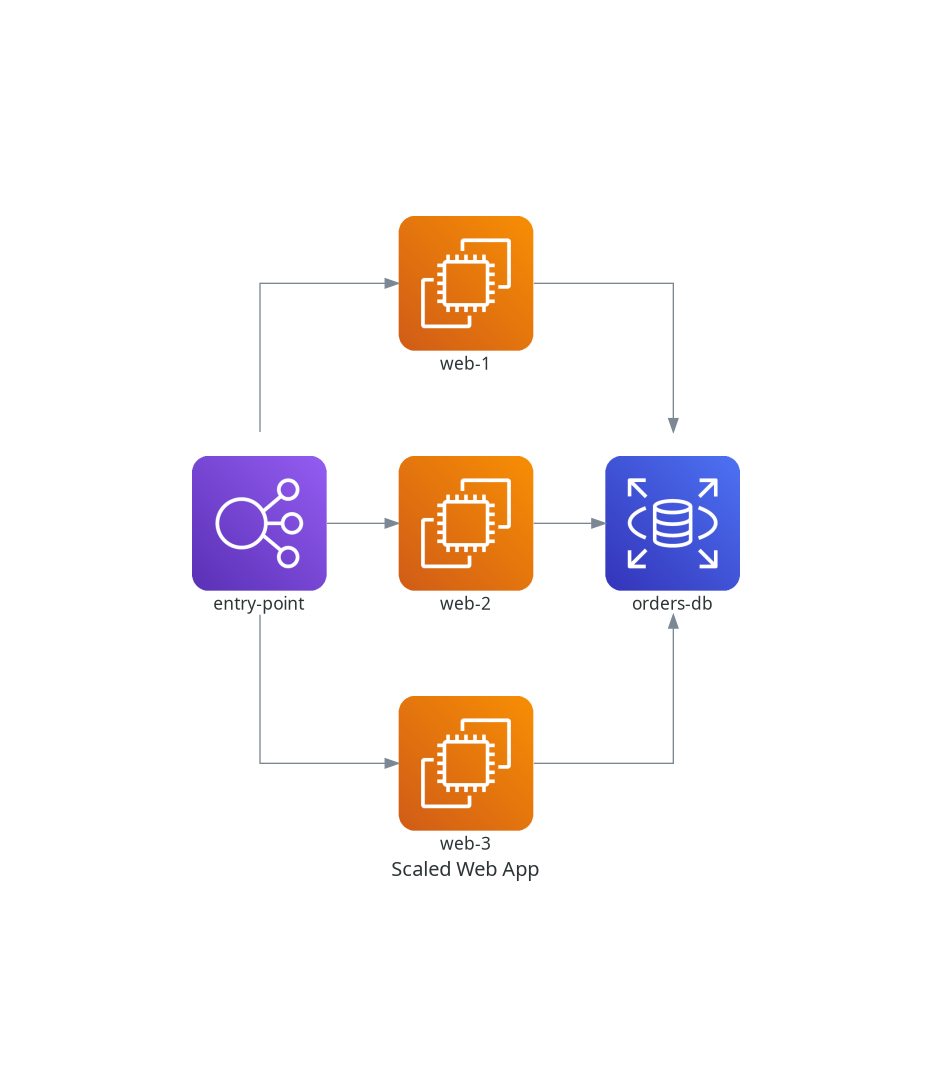
The >>, <<, and - operators respectively represent left-to-right flow, right-to-left flow, and undirected connections. You can also connect one node to a list of nodes, which is invaluable for representing scaled-out components without redundant connection statements:
with Diagram("Scaled Web App"):
    load_balancer = ELB("entry-point")

    web_servers = [
        EC2("web-1"),
        EC2("web-2"),
        EC2("web-3")
    ]

    database = RDS("orders-db")

    load_balancer >> web_servers >> database
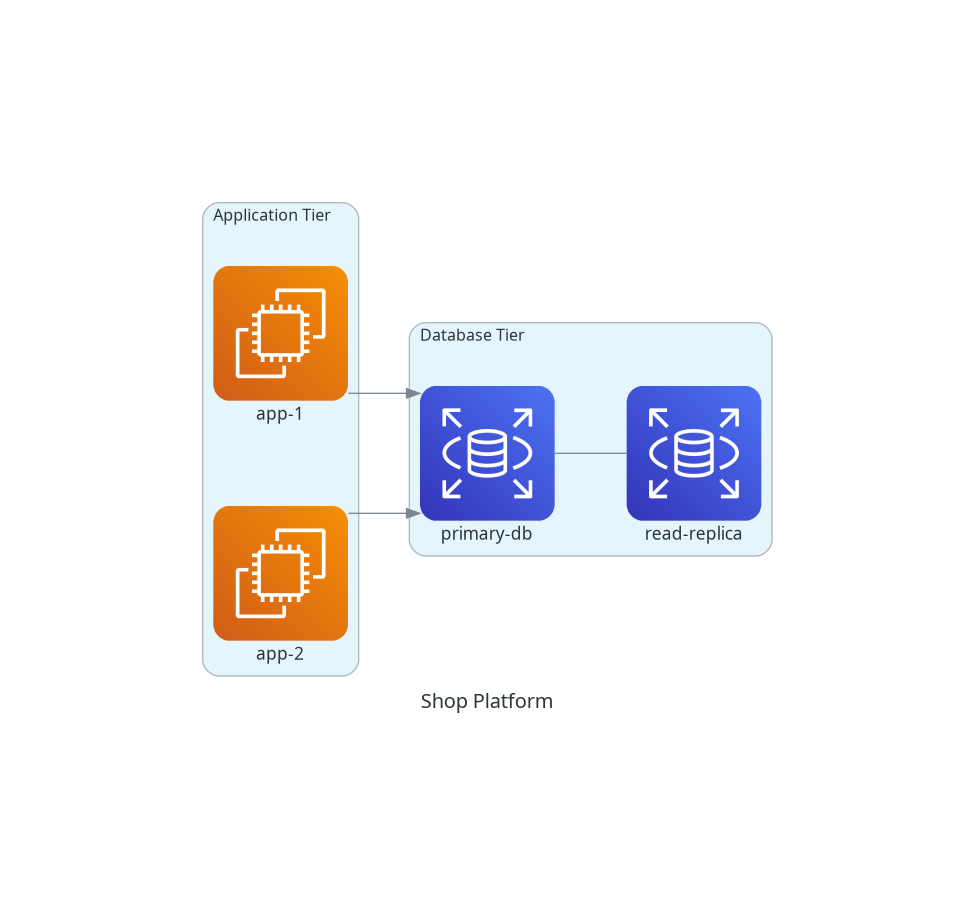
The Cluster construct is where things get properly interesting for representing real system boundaries. Grouping related nodes into labeled boxes lets you communicate application tiers, availability zones, environments, and microservice groups without losing the relationships between them:
from diagrams import Diagram, Cluster
from diagrams.aws.compute import EC2
from diagrams.aws.database import RDS

with Diagram("Shop Platform"):
    with Cluster("Application Tier"):
        apps = [
            EC2("app-1"),
            EC2("app-2")
        ]

    with Cluster("Database Tier"):
        primary_db = RDS("primary-db")
        replica_db = RDS("read-replica")

    apps >> primary_db
    primary_db - replica_db
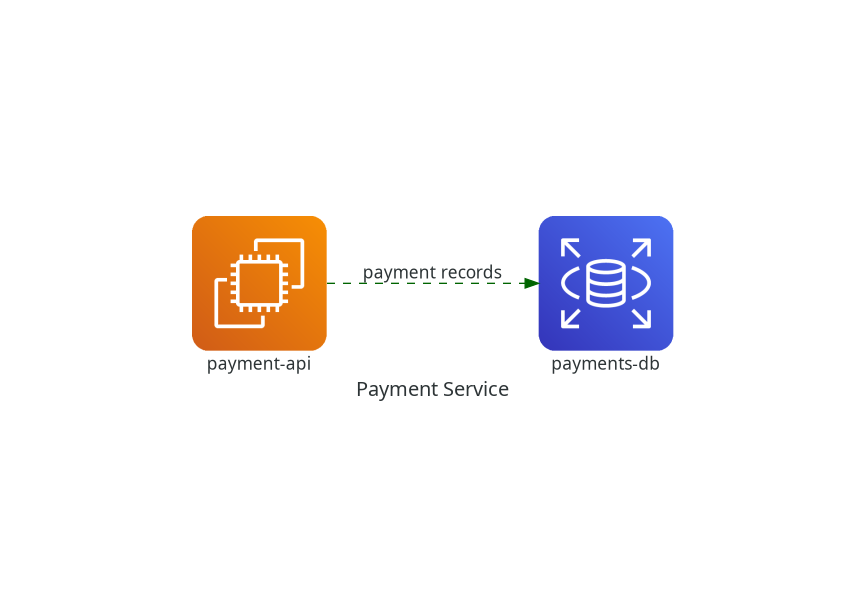
And it gets even better. Edges let you add behavioral context to your diagrams, labeling, coloring, and styling connections to represent the nature of the interaction:
from diagrams import Diagram, Edge
from diagrams.aws.compute import EC2
from diagrams.aws.database import RDS

with Diagram("Payment Service"):
    api = EC2("payment-api")
    database = RDS("payments-db")

    api >> Edge(
        label="payment records",
        color="darkgreen",
        style="dashed"
    ) >> database
The Push-Button Architecture Pipeline
The real payoff comes when you wire diagram generation into your build pipeline. The freeCodeCamp tutorial on system design diagrams demonstrates exactly how this works: you write a Python file that describes your architecture, run it as part of your documentation build, and the output images are generated fresh every time.
The value proposition is clear, enforcing architectural integrity through automated build checks extends naturally to diagram generation. If your diagrams are code, they can be validated, tested, and even used as the source of truth for architectural enforcement.
The process flow is straightforward:

You’re describing infrastructure instead of drawing it. No more nudging icons pixel by pixel, no more fighting with alignment guides, no more “let me just move this box slightly to the left”, you describe what exists, and the rendering engine handles the aesthetics.
Mermaid: The Markdown-Native Rendering Layer
Mermaid has become the default rendering layer for code-based diagrams, and for good reason. It’s a JavaScript-based diagramming tool that uses Markdown-inspired text definitions. The npm package shows 13.8 million weekly downloads for version 12.1.0, which puts it in the same adoption territory as major frameworks. It supports 20+ diagram types, including flowcharts, sequence diagrams, class diagrams, state diagrams, and C4 diagrams, and its syntax is version-control friendly, your diagrams become diffable text.

The killer feature is native GitHub rendering. Mermaid code blocks render directly in Markdown files on GitHub, which means your diagrams can live right in your README and show up without any additional tooling. Mermaid was essentially built to solve what the project itself calls “doc-rot”, the Catch-22 where diagramming costs precious developer time but the lack of visual documentation ruins productivity and organizational learning.
The C4 diagram support in Mermaid is particularly relevant for architecture work:
C4Context
title System Context diagram for Internet Banking System

Person(customerA, "Banking Customer A")
System(SystemAA, "Internet Banking System", "Allows customers to view information about their bank accounts, and make payments.")
SystemDb_Ext(SystemE, "Mainframe Banking System", "Stores all of the core banking information")

Rel(SystemAA, SystemE, "Uses")
Rel(SystemAA, SystemC, "Sends e-mails", "SMTP")
For teams already using Mermaid, the official guide has become the standard reference, it even has a printed book now, which is somehow both deeply nerdy and completely fitting for a diagramming tool.
The AI Wild Card: Agents That Write Architecture
Here’s where things get genuinely interesting, and slightly uncomfortable. Archify takes a different approach. Instead of extracting structure directly from code, it’s a plugin for coding agents like Cursor, Claude Code, and Codex CLI. You ask the agent to map your repository, it reads the code, and then it writes a small structured file listing components, boundaries, and connections. A Node.js tool validates that file against expected shapes and layout rules, then draws the diagram.
The architecture here is deliberately split: the model handles judgment and analysis, while plain code handles rendering. The model never draws the picture itself, it writes structured data that a deterministic renderer turns into a diagram. This prevents the horrible mess of an AI trying to generate SVG or canvas code directly, which always produces something that looks like a toddler with a crayon attacked a spreadsheet.
But before you get too excited, here’s the honesty pill: in Archify’s own benchmark, ordinary coding models produced a first-pass-usable diagram in 8 of 15 runs, 53%. That’s barely better than a coin flip. The tool does make failures cheap, a failed check names the exact node to fix, and only a passing diagram replaces the last good one. But you’re still looking at a human review loop.
The more genuinely useful feature is version comparison. Because each diagram is a file, you can diff two versions. One command sets a base and head snapshot side by side as Before, Delta, and After, showing what was added, removed, changed, moved, and rerouted. That answers the question every architect gets asked in review: “What did this PR actually change about the system?”
The Counterargument: Diagrams From Code Are Useless
Not everyone is sold. There’s a persistent critique from the architecture community that diagrams generated from codebases are largely useless because code doesn’t contain all the information needed to represent the real business logic.
This critique is partially fair. Your code knows about function calls and class dependencies, but it doesn’t know why a particular service exists, what business capability it serves, or what the intended evolution path is. A diagram that mechanically extracts call graphs misses the entire “why” layer of architecture. It shows you how a system is wired together, not whether that wiring makes sense.
The pragmatic middle ground is to define constraints, primitives, and boundaries, what counts as a service, a domain, or a system, and then let tooling populate the details within those rulesets. Once you have those boundaries defined, AI agents can update docs and diagrams based on these rulesets rather than producing a free-for-all Mermaid diagram with different outputs every time.
It’s worth noting that sequence diagrams have become surprisingly good. If AI models can understand a logic flow well enough to modify it, they can create a sequence diagram of that same flow. This is the same extraction challenge that plagues AI initiatives trying to pull meaning from legacy systems, but the success rate is higher for well-structured modern codebases.
What Actually Works in Practice
The teams that solve this problem follow a consistent pattern, regardless of their specific tool choices:
1. Pick a machine-readable format for architectural truth. Structurizr DSL is the gold standard when you want proper C4 support. The C4 model’s structure maps naturally to structured data, and ParallelStructure’s C4 generator libraries exist for most languages.
2. Commit that format to the repository alongside code. This is non-negotiable. The moment your architecture lives in some diagramming tool’s proprietary database, it’s already out of sync with reality.
3. Wire regeneration into CI/CD. A pipeline step that regenerates diagrams from the structured source on every merge keeps everything honest.
4. Accept that you can’t automate everything. The best-automating teams combine generated diagrams with hand-crafted C4 elements for the parts that matter, business context, system boundaries, and intentional architecture, while letting tooling handle the mechanical extraction.
The Verdict
Architecture diagrams are too important to trust to manual maintenance. The tools have matured past the point where “we need to update the diagram” is a reasonable excuse for stale documentation. Whether you choose the full Structurizr workflow, the Python Diagrams library, or an AI-agent-powered pipeline, the principle is identical: your diagrams should be derived from your code, not maintained alongside it.
The bigger risk, worth naming explicitly: as AI changes how teams encode knowledge, there’s a real danger of tacit architectural knowledge liquifying. If you automate all your diagrams without capturing the reasoning behind them, you’re just generating pretty pictures that conveniently confirm whatever the code already does.
The best architecture automation doesn’t just reveal what your system is, it makes visible what your system should be and where the gaps between intent and reality live. That’s the diagram worth generating.