The AI community has been playing a rigged game, and Gemini 3 Pro just exposed the rules. While benchmark scores continue their upward march, a closer look reveals a pattern: models that ace specific tests often collapse when slightly off their training distribution. The problem isn’t just about performance, it’s about the illusion of progress created by metrics that can be gamed.
Researchers have pointed out that traditional evaluation gives a distorted view. A model scoring 95% on reasoning tasks but 25% on coding can still report a deceptively strong average. The real question isn’t how high a model scores on cherry-picked benchmarks, but how consistently it performs across the messy, heterogeneous reality of actual tasks. This is where power-mean aggregation enters the picture, and where Gemini 3 Pro demonstrates something unprecedented.
The Benchmark Game and Its Hidden Weaknesses
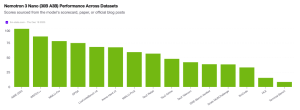
Standard practice involves reporting isolated scores: 91.9% on GPQA Diamond, 31.1% on ARC-AGI-2, 100% on AIME with code execution. These numbers look impressive in press releases but hide catastrophic failures. A model can dominate mathematical reasoning while struggling with basic multimodal comprehension, yet still be marketed as “state-of-the-art.”
The issue lies in interpretability of averages. When vendors optimize for specific benchmark suites, they create models with spiky capability profiles, excellent in narrow domains, brittle everywhere else. This optimization strategy works because consumers rarely examine the full distribution of performance. They see the peak, not the valleys.
Power-Mean Aggregation: A Stress Test for Balance
Recent work on coherence-based evaluation proposes a more rigorous approach. Instead of averaging scores linearly, it applies a spectrum of power means across benchmarks. The generalized mean formula raises each score to power p, averages them, then takes the p-th root. By varying p from 1 (standard arithmetic mean) down to -1 (harmonic mean), you create a “coherence curve” where:
- Positive powers reward models with standout strengths (compensatory scoring)
- Negative powers punish inconsistency, heavily penalizing any weak task (non-compensatory scoring)
- The shape of the curve reveals the model’s true capability distribution
A robust general intelligence should maintain performance across this entire spectrum. A narrow specialist will see its curve collapse as the power turns negative.
Gemini 3 Pro’s Unprecedented Stability
Analysis across 17 shared percentage-based benchmarks, from reasoning and math to multimodal and long-context tasks, produces striking results. When plotted across powers p ∈ [-1, 1], most frontier models show sharp drops in the negative region. Claude 4.5 Sonnet’s curve dips to 40% coherence AUC. GPT-5.1 follows at 37%. Gemini 2.5 Pro trails at 33%.
Gemini 3 Pro holds at 67%. Not just higher, structurally different. Its curve stays elevated across the full continuum, showing remarkably little collapse even under harsh non-compensatory weighting. This indicates genuine capability balance rather than benchmark-specific tuning.
The practical impact surfaces in long-horizon agentic tasks. On Vending-Bench 2, a simulated year-long business management test measuring coherent decision-making, Gemini 3 Pro achieves a mean net worth of $5,478.16, compared to $1,000-2,000 for competing models. This isn’t a marginal improvement, it’s a 272% gap in sustained, multi-step reliability.
Why the Negative-Power Region Matters
The negative-power region acts as a lie detector. Models with hidden weaknesses, poor tool use, inconsistent reasoning, brittle multimodal understanding, see their scores punished exponentially here. Gemini 3 Pro’s resistance to this collapse suggests something fundamental: its capabilities are more evenly distributed throughout the architecture.
This matters for deployment. In production systems, models encounter unpredictable query distributions. A model that fails catastrophically on 10% of inputs creates unacceptable risk, regardless of its 90th percentile performance. The negative-power region quantifies exactly this failure mode.
Implications: From Peak Performance to Capability Balance
The AI evaluation establishment faces a reckoning. If coherence curves become standard:
- Model selection shifts from “highest score on my use case” to “lowest risk of catastrophic failure”
- Training incentives change, optimizing for balance rather than benchmark-specific peaks
- Safety evaluation improves, brittleness becomes visible before deployment
- AGI metrics get more honest, coherence across tasks matters more than mastering narrow domains
Critics have long argued we’ve been measuring the wrong thing. The “A Coherence-Based Measure of AGI” paper formalized this critique, proposing the AUC integration as a robustness metric. Gemini 3 Pro provides the first large-scale validation that this approach reveals meaningful differences between models.
Limitations and Needed Context
These coherence scores are not AGI percentages. The 17 benchmarks used cover reasoning, math, coding, and multimodal tasks but exclude critical dimensions like continual learning, long-term memory accumulation, and open-ended goal stability. They answer “How stable is performance on current evaluation suites?” not “How close to general intelligence?”
Even within these limits, the improvement is significant. The 27-point gap between Gemini 3 Pro and Claude 4.5 Sonnet in coherence AUC represents a structural shift, not incremental tuning. But until we see similar stability on tests measuring genuine long-term autonomy, this remains a promising signal rather than proof of conceptual breakthrough.
The New Evaluation Standard
The AI community loves its leaderboard culture, but leaders can be gamed. Coherence curves resist gaming, you can’t optimize for them without genuinely improving weak areas. Vulnerability in any single task drags down the entire negative-power region.
What Gemini 3 Pro demonstrates is that the frontier is advancing not just in altitude, but in terrain coverage. For practitioners building production systems, this balance translates directly into reliability. An agent that consistently uses tools correctly over 200 simulated days is simply more trustworthy than one that scores higher on static tests but veers into meltdown loops when contexts shift.
The test now is whether the field follows. If coherence becomes a standard reporting metric, we might finally escape the benchmark whack-a-mole game and start measuring what actually matters: robust, general capability. Until then, Gemini 3 Pro’s stability serves as both technical achievement and methodological proof-of-concept, a new way to separate genuine progress from statistical sleight-of-hand.