Don’t you hate it when things get worse? Degrading quality is a common theme in modern life, less so in tech, where we’ve grown accustomed to seeing prices rise while quality stays the same, or quality fall while prices hold steady. It’s rare, and genuinely disappointing, to see both happen at once. It’s extremely annoying when they both happen in tech.
Someone needed to say it: DigitalOcean’s new “Advanced” PostgreSQL tier is shrinkflation and inflation packaged as a SaaS product.
Over two weeks, an independent developer created 100+ databases and ran 59 hours of benchmarks to expose what the marketing blog post didn’t mention. Spoiler alert: every single performance claim DigitalOcean made about the new tier was false in the real world.
The Claims vs. The Reality
DigitalOcean’s launch announcement promised the Advanced tier would deliver “up to 38% higher throughput alongside a 50% reduction in p99 latency.” It’s “Engineered for scalability” with rapid failover that avoids application reconnects in under 3 seconds.
The actual benchmark results tell a different story:
| Metric | Standard Tier | Advanced Tier | Difference |
|---|---|---|---|
| Write TPS (32 vCPU) | 26,489 | 6,891 | 74% lower |
| Read TPS (32 vCPU) | 203,544 | 54,040 | 73.4% lower |
| p99 Write Latency (32 vCPU) | 6.7 ms | 35.9 ms | 5.4x worse |
| p99 Read Latency (32 vCPU) | 0.74 ms | 4.17 ms | 5.6x worse |
| Average Startup Time (15 regions) | 3m 19s | 16m 06s | 4.8x slower |
The worst-case write latency degradation hit 436% higher p99 latency (6.7ms → 35.9ms at 32 vCPU). Even at the smallest tier, the Advanced option was 3-4x slower on both p95 and p99 write metrics. The “revolutionary” performance gains mostly revolutionized the marketing department’s ability to publish creative fiction.
How the Benchmarks Were Run
The methodology matters here because these aren’t cherry-picked numbers. The full detailed results and methodology are publicly available. Here’s what was tested:
- Max Write TPS per tier with p95/p99 latency
- Max Read TPS per tier with p95/p99 latency
- Cold Startup Times (timed from create request to first successful query)
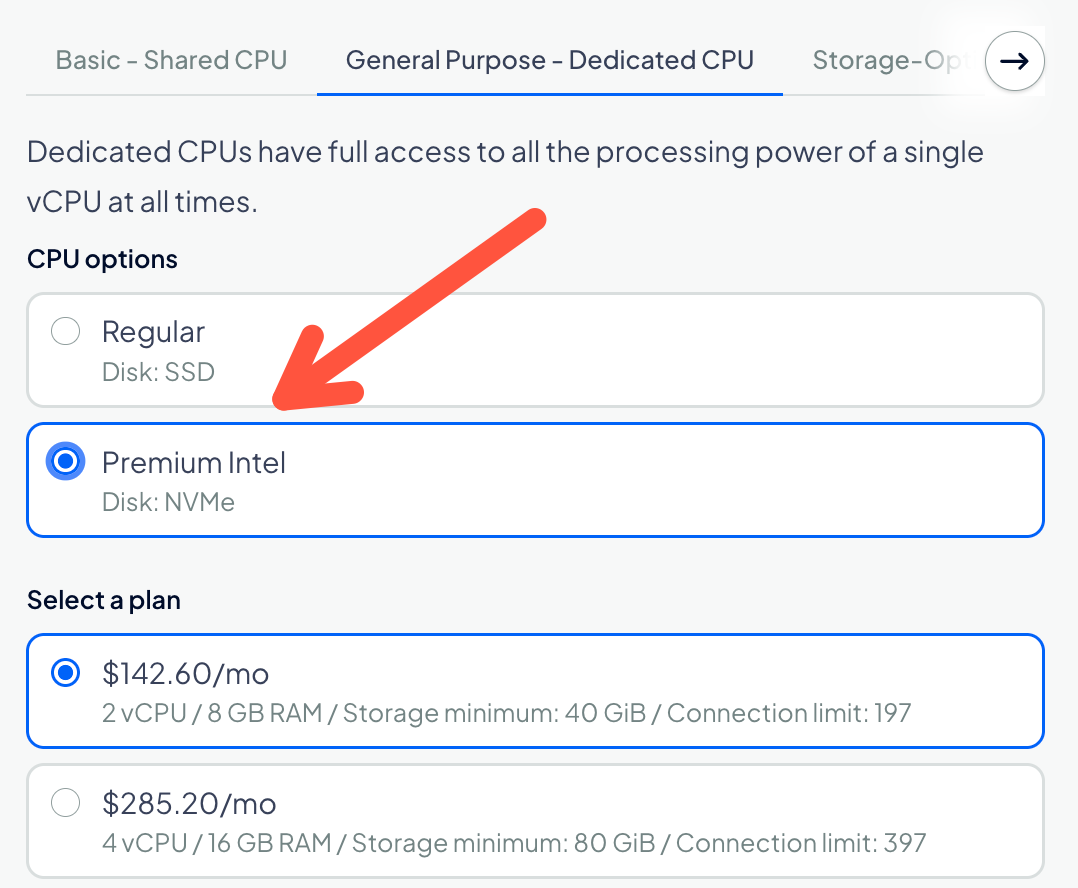
All tests ran on the General Purpose tier with dedicated Premium Intel vCPUs and NVMe disks, using PG 18. The testing tool was pgbench with a 1-minute warmup and 5-minute timed runs. Every test was repeated 3 times per database size, across 2 vCPU to 32 vCPU configurations, with data recreated before each run.
This wasn’t a quick smoke test. The person who ran it burned a few hundred dollars of their own money on DigitalOcean credits, going through ~100+ database creations across 15 regions. The startup time data alone spans every region DigitalOcean offers, from San Francisco to Singapore.
The Write Throughput Disaster
The write test uses pgbench’s built-in TPC-B-like workload. Each transaction consists of three UPDATEs, one SELECT, and one INSERT:
BEGIN
  UPDATE pgbench_accounts SET abalance = abalance + :delta WHERE aid = :aid;
  SELECT abalance FROM pgbench_accounts WHERE aid = :aid;
  UPDATE pgbench_tellers SET tbalance = tbalance + :delta WHERE tid = :tid;
  UPDATE pgbench_branches SET bbalance = bbalance + :delta WHERE bid = :bid;
  INSERT INTO pgbench_history (tid, bid, aid, delta, mtime)
    VALUES (:tid, :bid, :aid, :delta, CURRENT_TIMESTAMP);
END;
The averaged results across all database sizes:
| Size | Standard Write TPS | Advanced Write TPS | Difference |
|---|---|---|---|
| 2 vCPU / 8 GiB | 2,074 | 639 | 69.2% lower |
| 4 vCPU / 16 GiB | 3,983 | 1,641 | 58.8% lower |
| 8 vCPU / 32 GiB | 13,227 | 3,768 | 71.5% lower |
| 16 vCPU / 64 GiB | 22,740 | 6,048 | 73.4% lower |
| 32 vCPU / 128 GiB | 26,489 | 6,891 | 74.0% lower |
“Advanced” supports roughly 70% fewer write transactions per second than Standard out of the box. That’s not an upgrade, that’s a systematic downgrade.
Digging further revealed something interesting: the Advanced tier had synchronous_commit enabled by default while Standard hadn’t. When both were set to on and re-tested, Standard’s TPS dropped as expected, yet Advanced was still 50-70% less throughput at every size. There’s no configuration tweak that explains this away.
Read Performance: Equally Brutal
The read test uses pgbench’s select-only workload:
SELECT abalance FROM pgbench_accounts WHERE aid = :aid;
| Size | Standard Read TPS | Advanced Read TPS | Difference |
|---|---|---|---|
| 2 vCPU / 8 GiB | 13,858 | 6,617 | 52.3% lower |
| 4 vCPU / 16 GiB | 26,582 | 15,168 | 42.9% lower |
| 8 vCPU / 32 GiB | 94,785 | 34,038 | 64.1% lower |
| 16 vCPU / 64 GiB | 166,617 | 45,797 | 72.5% lower |
| 32 vCPU / 128 GiB | 203,544 | 54,040 | 73.4% lower |
Advanced supports ~61% fewer reads per second than Standard. A customer would be furious if their Standard database degraded like this overnight. DigitalOcean is selling this as an “Advanced” option.
Notice something crucial: Advanced seems to peak out at 40-60k Read TPS regardless of size. Upgrading from 16 vCPU to 32 vCPU barely moved the needle (45,797 → 54,040 reads/s). That’s a hard ceiling that shouldn’t exist at these compute levels.
Latency: The Marketing Claim That Hurt Most
DigitalOcean claims a “50% reduction in p99 latency.” The reality:
| Size | Standard p99 Write | Advanced p99 Write | p99 diff | Standard p95 Write | Advanced p95 Write | p95 diff |
|---|---|---|---|---|---|---|
| 2 vCPU / 8 GiB | 9.8 ms | 41.6 ms | 4.2x | 6.9 ms | 23.3 ms | 3.4x |
| 4 vCPU / 16 GiB | 8.7 ms | 25.2 ms | 2.9x | 5.8 ms | 17.3 ms | 3.0x |
| 8 vCPU / 32 GiB | 4.8 ms | 18.7 ms | 3.9x | 3.6 ms | 12.6 ms | 3.5x |
| 16 vCPU / 64 GiB | 4.9 ms | 22.4 ms | 4.6x | 3.6 ms | 16.0 ms | 4.4x |
| 32 vCPU / 128 GiB | 6.7 ms | 35.9 ms | 5.4x | 5.2 ms | 23.7 ms | 4.6x |
Write latency was 200-440% higher at every tier. The median latency (p50) went from 1.9ms to 5.5ms.
Read latency wasn’t spared either, 70% to 460% higher, depending on instance size. The 2ms to 4ms difference might not matter for most workloads, but the trend is unmistakable.
The Startup Time Regression
This test was simple: create a new 2 vCPU database in each region, sequentially, and time how long until it answers its first query. The results are shocking:
| Region | Standard | Advanced | Diff |
|---|---|---|---|
| San Francisco (SFO2) | 3m 38s | 13m 46s | 3.8x |
| London (LON1) | 2m 32s | 14m 50s | 5.9x |
| Amsterdam (AMS3) | 2m 41s | 16m 00s | 6.0x |
| Bangalore (BLR1) | 3m 18s | 24m 51s | 7.5x |
| Singapore (SGP1) | 4m 13s | 30m 01s | 7.1x |
| Average (15 regions) | 3m 19s | 16m 06s | 4.8x |
On average, Advanced took about five times as long to start as Standard. On the smallest 2 vCPU tier. The one that should be the easiest to provision.
Bangalore and Singapore are particularly grim, a 30-minute wait just to get a database that answers a single query. That’s not “engineered for scalability”, that’s engineered for waiting.
The PgBouncer Bottleneck: A Structural Design Flaw
The reason behind these regressions appears to be architectural. If you look at the test data, Advanced didn’t scale much beyond 16 vCPU:
- Writes went from 6,048 to 6,891 TPS (16 → 32 vCPU)
- Reads went from 45,797 to 54,040 TPS (16 → 32 vCPU)
This low ceiling perplexed the researcher, so they dug deeper. The breakthrough came when they tested a trivial SELECT 1 query, it hit the same statement-per-second ceiling. But when they batched 10 reads per transaction, Advanced managed 221,000 statements/s instead of 47,000/s.
The database could clearly handle far more queries. Something in front of it wasn’t sending them fast enough. The culprit: PgBouncer.
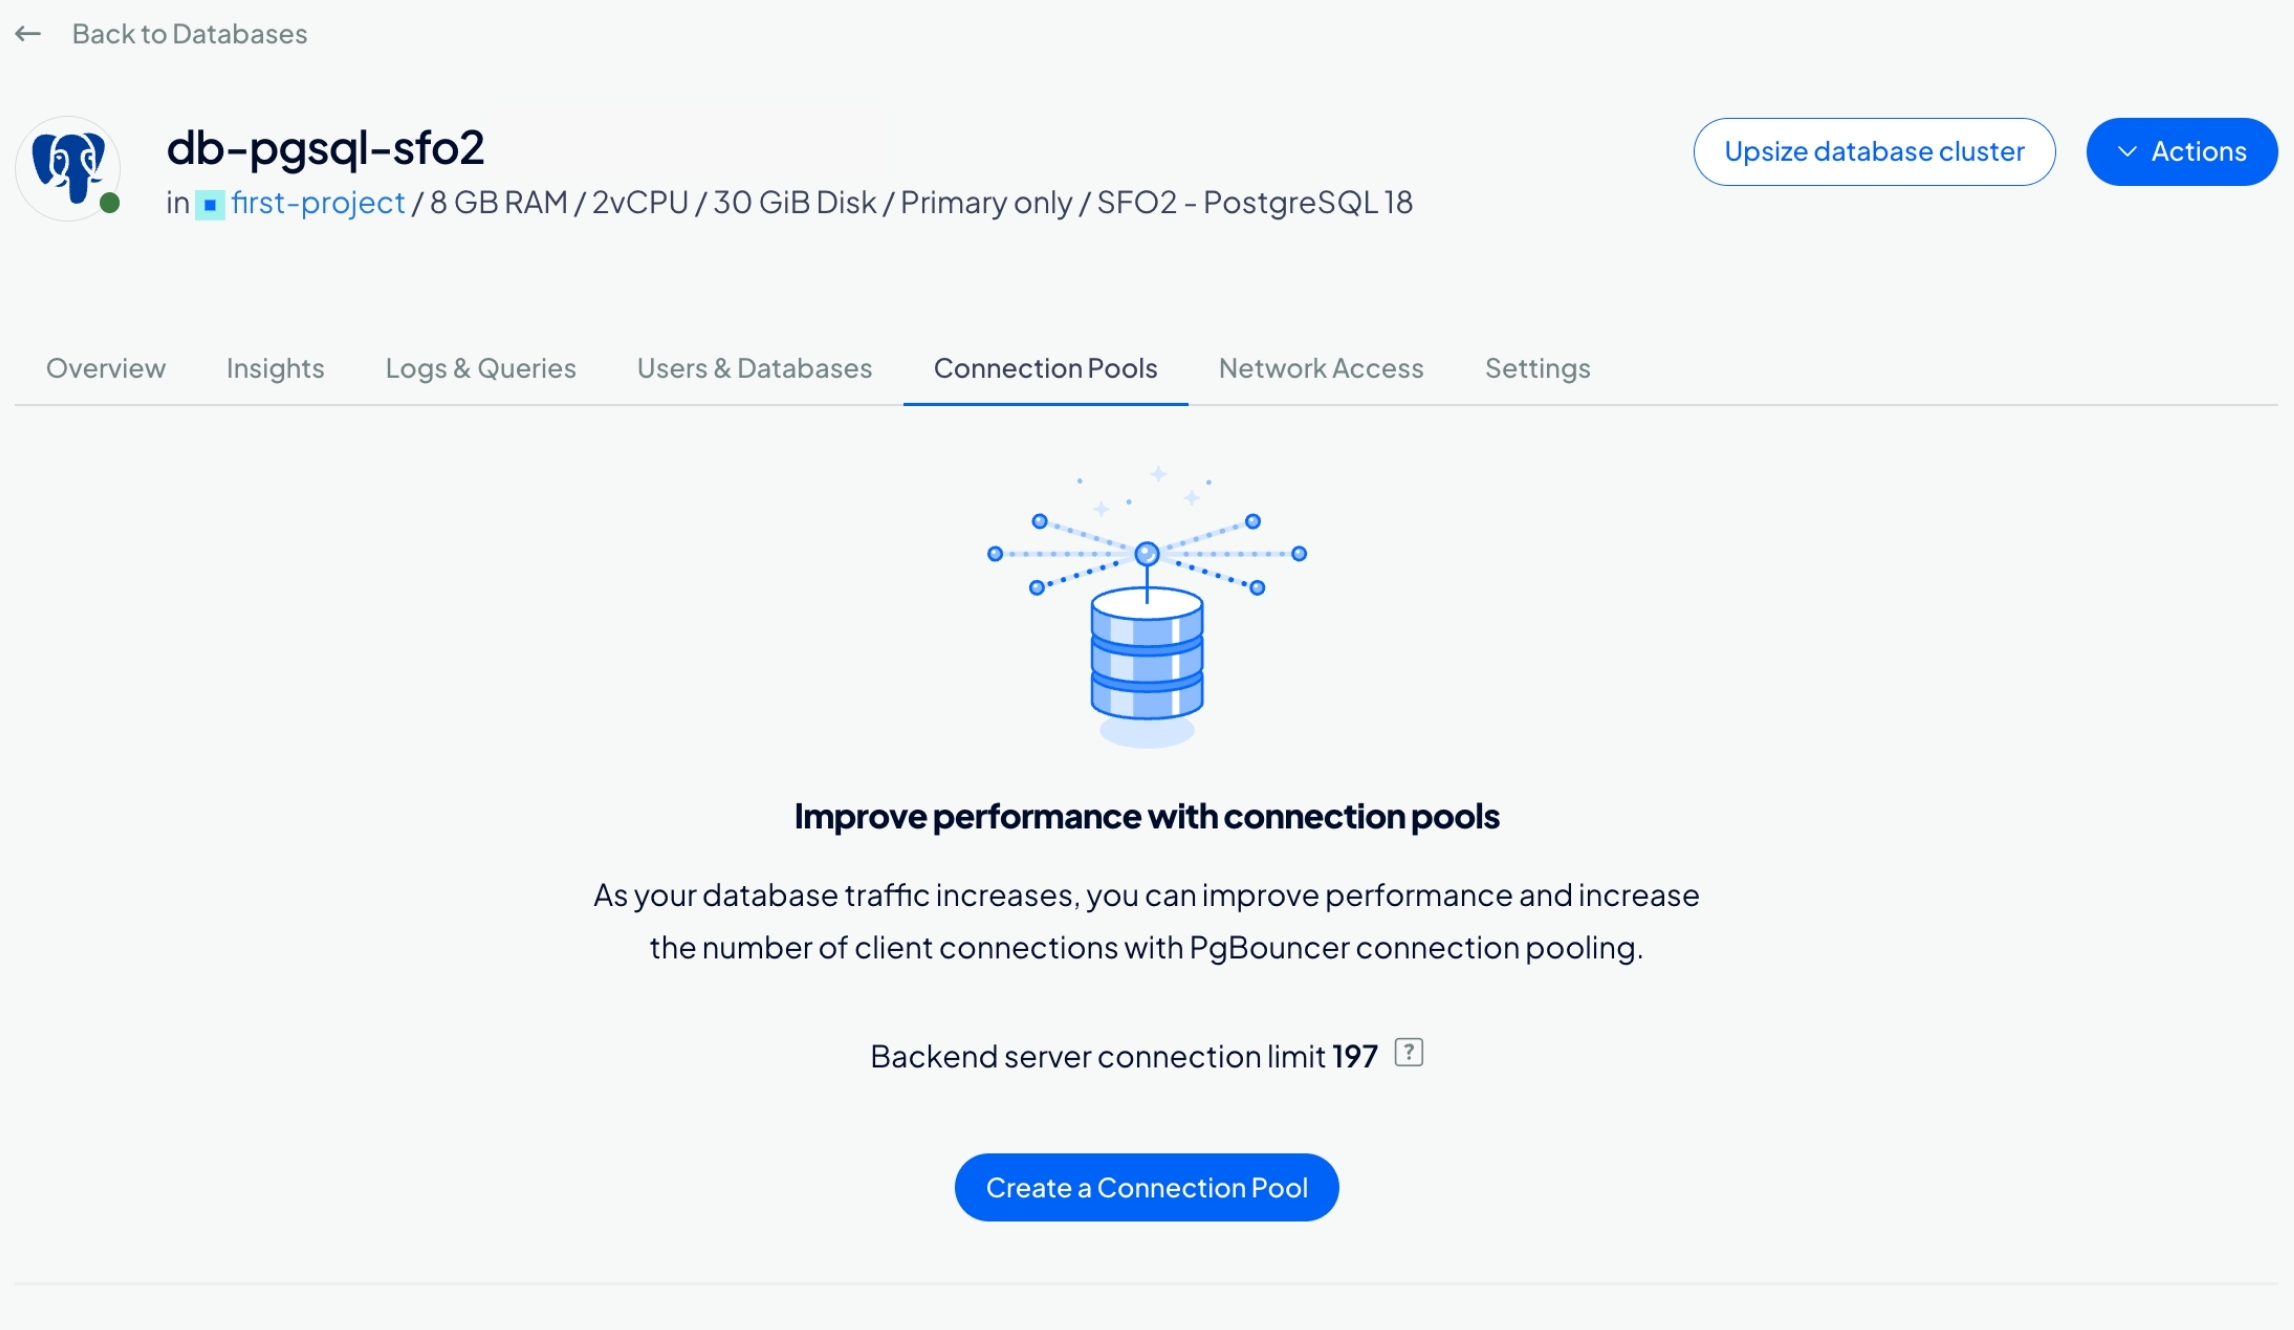
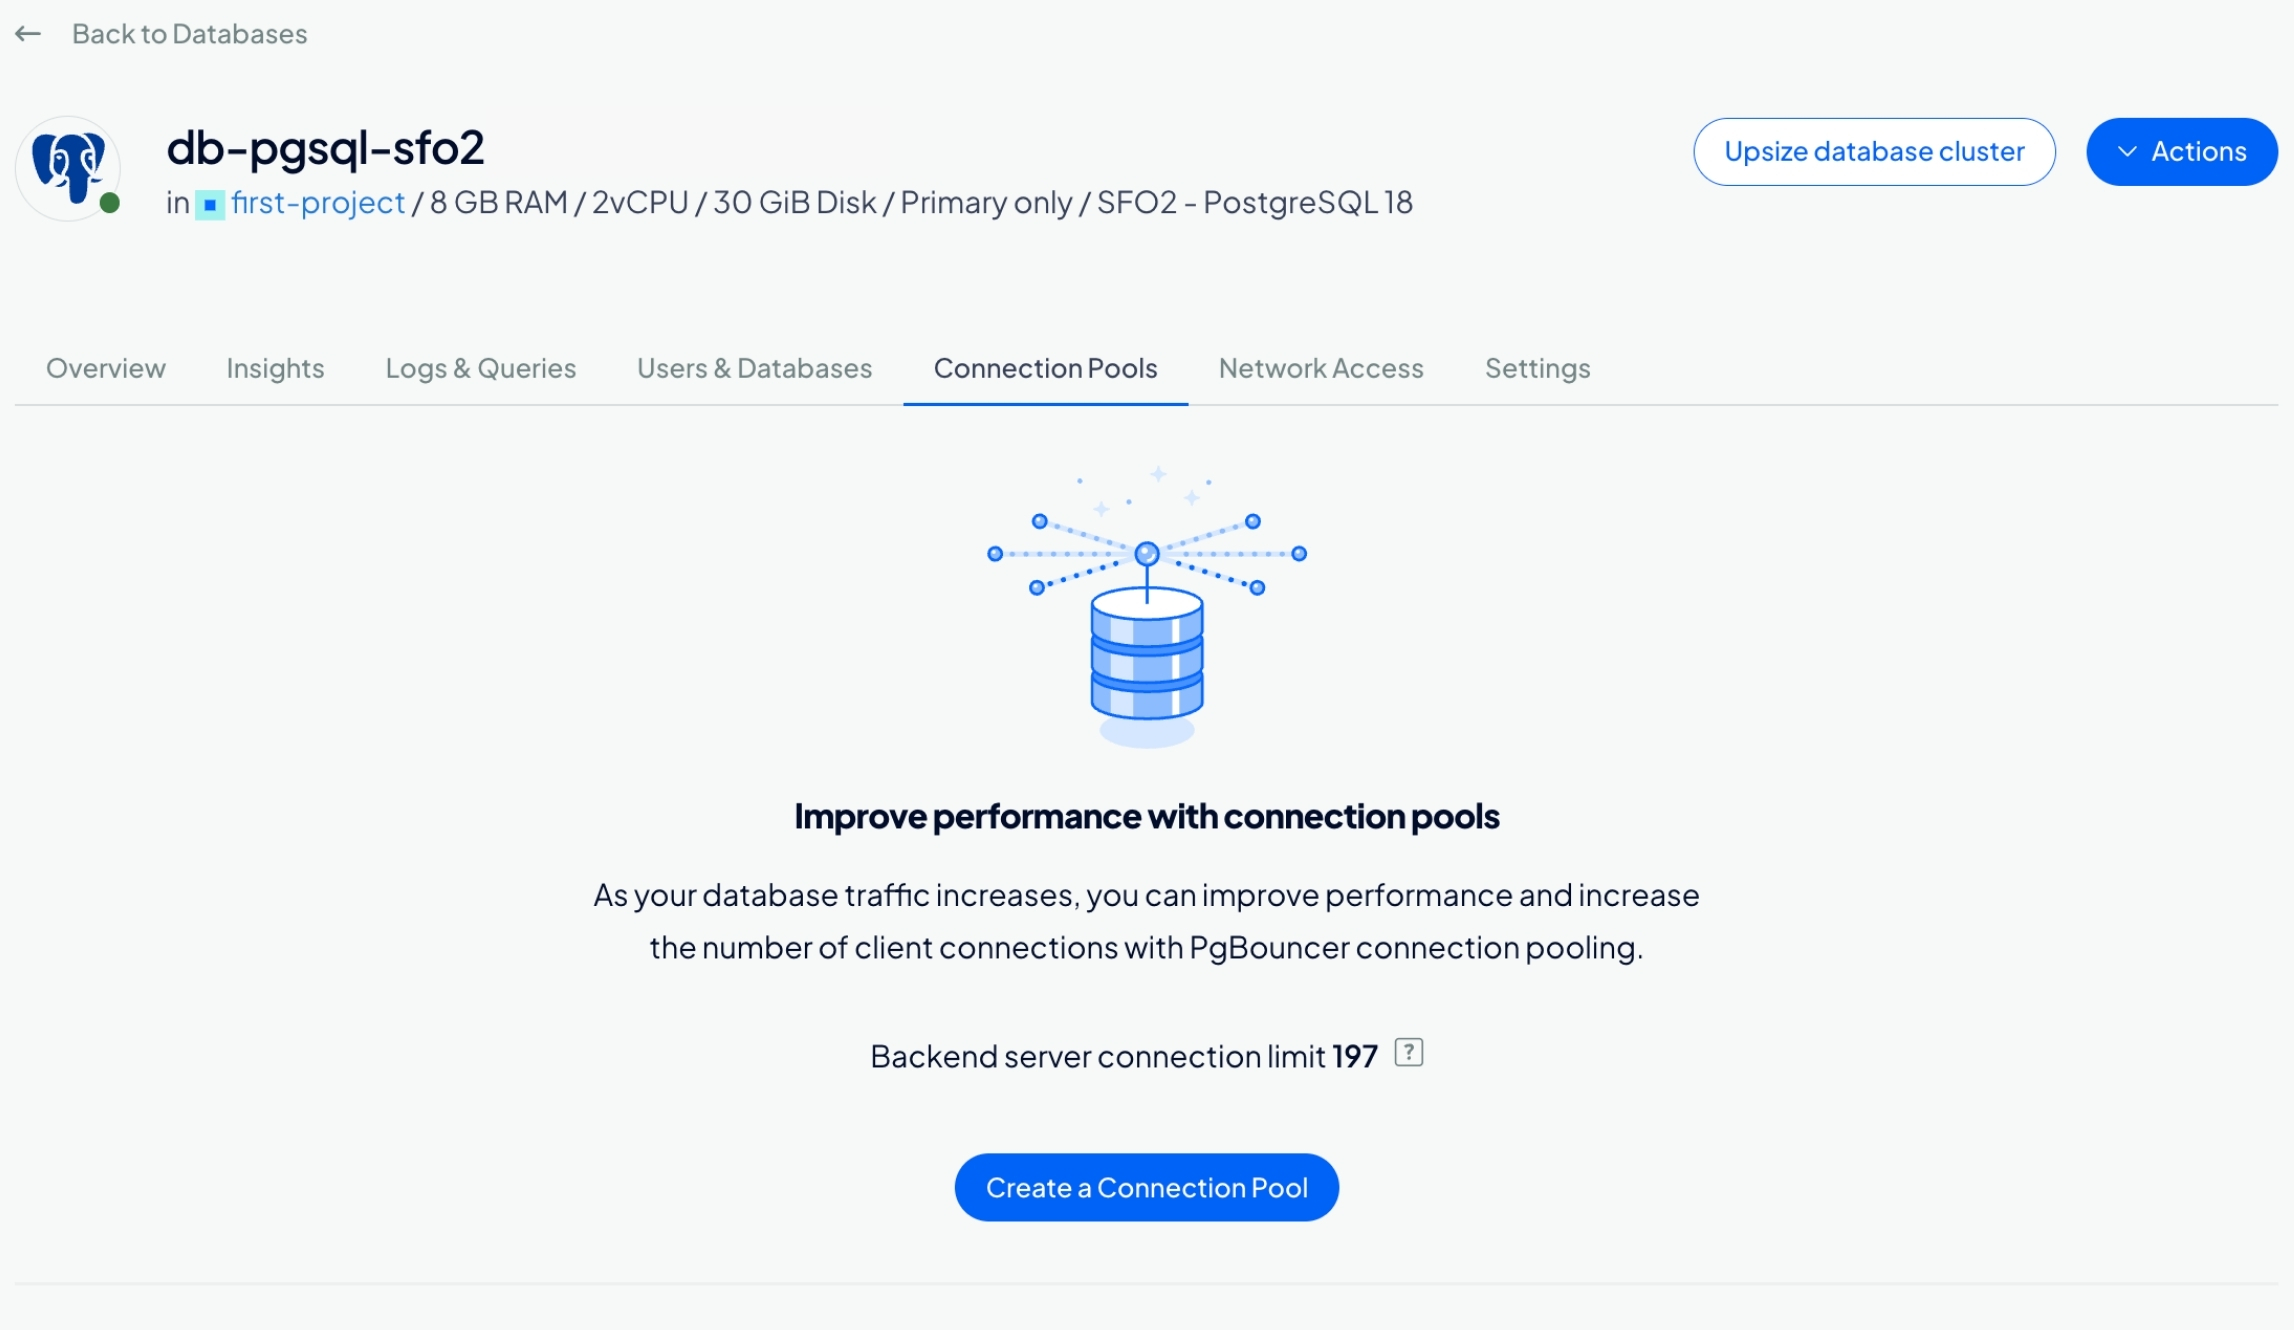
Postgres is poor at handling many connections because each connection spawns a new OS process. Always-on connection pooling is standard practice, which is why DigitalOcean bundled PgBouncer into the Advanced tier. But here’s the problem: PgBouncer is single-threaded per process, and DigitalOcean gives you no visibility or control over how many processes run behind the scenes.
Evidence strongly suggests they’re running a small, fixed pooler setup regardless of plan size. The benchmark numbers match a 2-process PgBouncer configuration, which is why Advanced flatlines at roughly 54k reads/s and 6.9k writes/s no matter how many vCPUs you throw at it.
To confirm this theory, the researcher took a Standard 32 vCPU database and ran it through various connection pooler setups:
| Setup | Reads/s | Write TPS | vs Direct |
|---|---|---|---|
| Direct (no pool) | 204,929 | 28,145 | 100% |
| DigitalOcean’s built-in pool (Standard) | 33,113 | 4,935 | 16-18% |
| 1 PgBouncer Droplet, 1 process | 30,003 | 4,373 | 15-16% |
| 1 droplet, 2 processes | 63,309 | 8,373 | 30-31% |
| 1 droplet, 8 processes | 82,583 | 11,803 | 40-42% |
| 2 droplets, 8 processes each | 165,059 | 22,851 | 81% |
| 3 droplets, 8 processes each | 197,222 | 24,930 | 89-96% |
The built-in pool on Advanced matches a 2-process setup almost perfectly. You’re paying for a 32 vCPU database but getting a connection path bottlenecked to roughly 2 cores of PgBouncer capacity.
What’s worse: there’s no supported way to connect around the pooler. Even DigitalOcean’s own docs recommend you run pg_dump directly against the database, bypassing the connection pool(s). Advanced doesn’t allow this. Postgres providers like Supabase and Neon deliberately give you both hostnames (db.neon.tech vs db-pooler.neon.tech) because migrations, pg_dump, long analytics queries, replication, and other session-feature-dependent work requires a direct connection.
DigitalOcean’s Advanced takes that flexibility away from you.
The Failover Claim: More Fine Print Than Substance
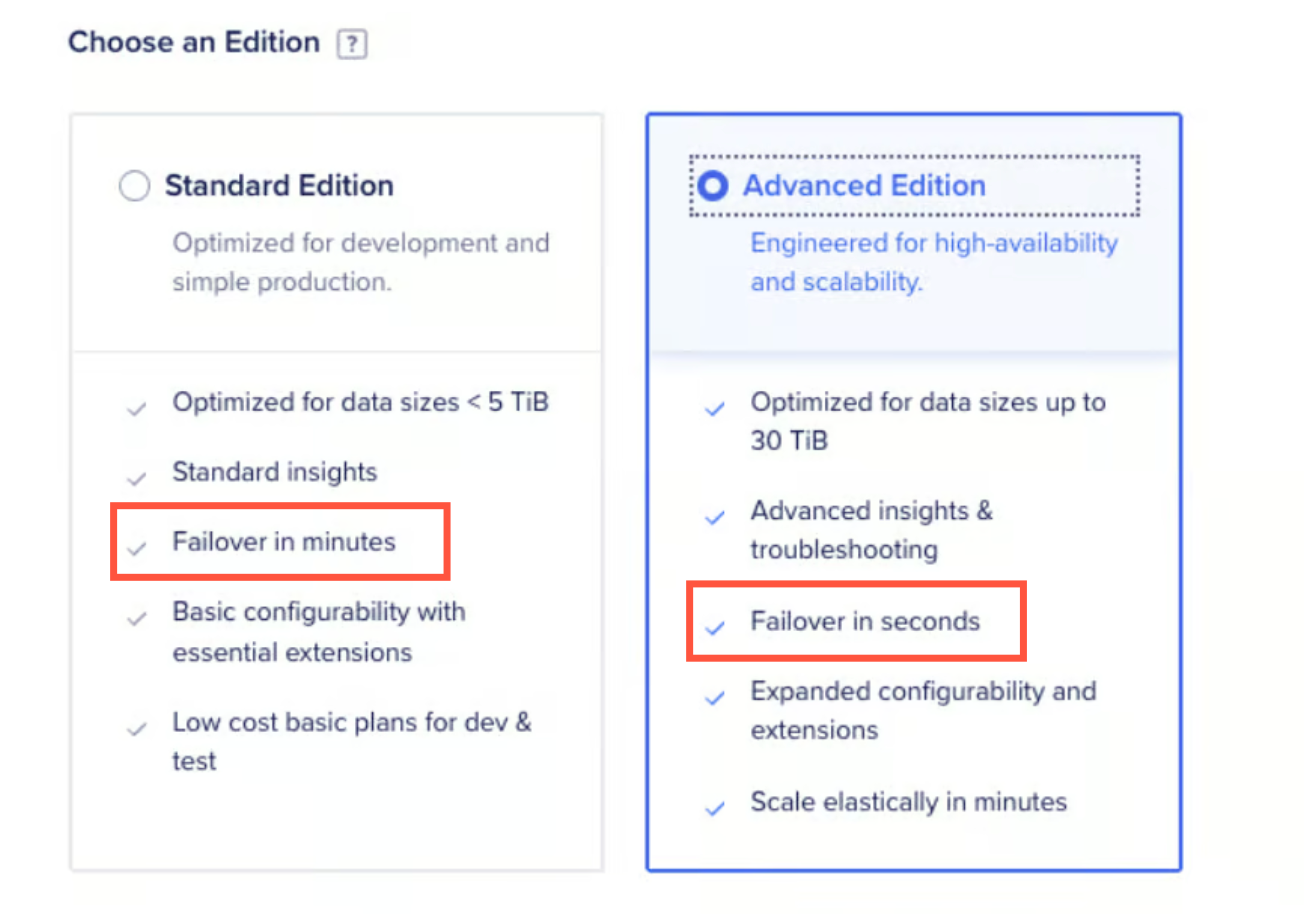
DigitalOcean’s edition picker proudly claims Standard “fails over in minutes” while Advanced does it “in seconds.”
The launch blog post states: “Advanced was built to remove the impact of database node rotations both for planned events like a maintenance installation or an unplanned failover. With a built in proxy, your application generally does not need to reconnect if the primary changes.”
Testing this claim meant simulating node rotations. On a cluster with a standby, every CPU/RAM resize moves the primary to a new machine, the closest safe proxy for a failover event. The researcher created 2 vCPU Standard and Advanced clusters with one standby each, resized them up and down (4 resizes per database), and kept eight persistent test connections open without immediately reconnecting after errors.
| Result | Standard | Standard + DO’s pool | Advanced |
|---|---|---|---|
| Application reconnects required | Yes | Yes | Yes |
| Acknowledged writes lost | 0 | 0 | 0 |
Advanced’s proxy did not remove the need for application reconnects during planned resizes. All three setups lost every persistent connection during every resize.
Here’s the marketing sleight of hand: the “rapid failover” claims were tested on MySQL Advanced Edition clusters, not PostgreSQL. From the fine print: “Across twenty primary-loss simulations in internal benchmarking, MySQL Advanced Edition clusters promoted a replacement primary in under 3 seconds on average.”
Postgres Advanced couldn’t avoid reconnects during a planned resize. Skepticism about its performance during an abrupt, unexpected failover seems entirely justified.
The Pricing: Every Way You Slice It, It Costs More
The performance regression would be embarrassing enough. But DigitalOcean also made the “upgrade” more expensive. The fine print reveals:
- Advanced costs 19.4%-26.5% more per vCPU ($67/mo → $90/mo for Premium Intel)
- Advanced’s storage costs 46.5% less per GiB ($0.215 → $0.115)
That storage discount sounds nice until you realize the CPU price increase swamps it at typical deployment sizes. The comparison depends on how much disk you buy:
| Disk Scenario | Premium Intel (NVMe) | Regular (SSD) |
|---|---|---|
| Each edition’s own minimum | +17.0% more expensive | +20.1% more expensive |
| Both at ~50% of Standard’s old maximum | +10.2% | +12.3% |
| Both at Standard’s old maximum | +3.4% at 5,000 GiB | -2.2% at 4,800 GiB |
| Storage Optimized at 50% max | -8.5% | -13.5% |
| Storage Optimized at old max | -22.5% at 30 TiB | -14.5% at 15 TiB |
At the minimum disk size, Advanced is 17-20% more expensive. At typical sizes, around 10% more expensive. Only if you max out disk on Storage-Optimized plans does it become cheaper, and that’s because the storage discount finally outweighs the CPU markup.
But here’s the killer: the price comparison from the hosting landscape perspective shows DigitalOcean was already positioned as a budget-friendly managed Postgres option. The Advanced tier erodes that position.
When you account for the actual read/write capability lost, the numbers are brutal:
The biggest Advanced plan (32 vCPU at $2,670/mo) did about half the work of an 8 vCPU Standard at $588/mo. For the same amount of work priced solely in transaction-per-second capability, Advanced costs 3.8x more for writes and 3.2x more for reads (averaged across the five sizes).
The 46% “price reduction” DigitalOcean’s announcement mentioned? That was comparing the old Advanced price to the new Advanced price. Not Advanced vs. Standard. The comparison was rigged from the start.
What This Means for Your Team
This isn’t just a DigitalOcean problem. It’s a cautionary tale about trusting vendor benchmark claims without independent verification.
The cloud vendor narrative around “better performance at lower cost” deserves the same scrutiny whether it’s about databases, AI models, or data orchestration platforms. The industry has seen similar dynamics play out across multiple domains, where “improvements” quietly erode the very benefits they promise.
For teams evaluating cloud database providers, the lessons are clear:
1. Run your own benchmarks before migrating. The two hours it takes to set up pgbench against your actual workload schema will save you months of production pain. The results here were found by “literally just turning on two default databases, testing and immediately finding red flags.”
2. Check the fine print on every claim. DigitalOcean’s throughput claim was technically correct for MySQL but irrelevant for Postgres. The latency claim only applied “during a failover” per the footnote, despite the headline saying it was a general improvement.
3. Understand the architectural implications of connection pooling. PgBouncer is essential infrastructure for production Postgres, but it can become a bottleneck. If your provider doesn’t let you control or bypass the pooler, your workloads that need session features (migrations, pg_dump, prepared statements) will suffer.
4. Calculate cost per transaction, not cost per vCPU. The 32 vCPU Advanced plan costs $2,670/mo and delivers 6,891 write TPS. An 8 vCPU Standard at $588/mo delivers 13,227 write TPS. Same workload, half the cost, on the “old” tier.
5. Be skeptical of upgrade mandates. DigitalOcean is sunsetting Standard for anything above 4 GiB of RAM as of November 30. Customers with 8+ vCPU workloads have no choice but to “upgrade”, at higher cost and dramatically worse performance. This is the kind of forced migration that should make every engineering team question vendor incentives.
The Unanswerable Question
The most baffling part isn’t that the product is bad. Products launch with bugs all the time. It’s that this regression was so easily discoverable.
Advanced DB has been in Public Preview since April 2026 and went GA in September. The benchmark results came from two weeks of testing by one individual. How did DigitalOcean’s internal QA, release engineering, and performance testing teams all miss this?
Did nobody run a simple latency and throughput benchmark comparing Standard against Advanced? The numbers are damning at every tier, in every region, across every metric tested.
This is what happens when vendor benchmarks are treated as authoritative without independent validation. The Infrastructure-as-a-Service market is getting dangerously comfortable with marketing-driven performance claims that don’t survive contact with real workloads.
The Bottom Line
DigitalOcean is outright downgrading its Standard database offering with its new “Advanced” option across all tiers. Let’s recap what “Advanced” actually delivers:
- Up to 436% slower for writes (despite claiming 50% faster)
- Up to 73% less throughput (despite claiming 38% more)
- 5x slower startup times across all 15 regions
- No way to bypass the PgBouncer bottleneck
- No direct connection option for migrations or session-feature workloads
- 17-20% more expensive at minimum sizes, with 3.2x-3.8x higher cost per transaction at scale
The marketing claims weren’t just optimistic, they were inverted from reality on nearly every axis. This level of mismatch between what’s sold and what’s delivered erodes confidence not just in DigitalOcean, but in the entire managed database industry’s ability to self-regulate its claims.
Until vendors start publishing reproducible, third-party-verified benchmarks alongside their launch announcements, the burden of due diligence falls entirely on the customer. Budget for benchmark time in your next cloud migration project. It’ll be the cheapest insurance you ever buy.